Commodities 2020 Mid-Year Video Series
by WaveTrack International| July 15, 2020 | No Comments

Commodities Hit Major Lows –‘Inflation-Pop’ Lift-Off – Next 2-3 Year Uptrends Underway
We’re pleased to announce today’s release is PART II, COMMODITIES – Part I was released last month and Part III will be published in late-July
• PART I – STOCK INDICES – out now!
• PART II – COMMODITIES – out now!
• PART III – CURRENCIES & INTEREST RATES – coming soon!
Elliott Wave Forecasts – Mid-Year 2020 – Summary
EW-Forecast Review – H1 2020
The Annual 2020 report published last January (2020) highlighted first-quarter Q1 ’20 downside risk across the commodities sector – ‘…This specifically applies to base metals like Copper, Aluminium and Lead’…’Commodities like Crude/Brent oil are still some way from ending corrective X wave declines that began from the Oct.’18 highs. So far, downside targets are still -32% per cent below current levels…’. It continued…’ The probability of a Q1 dip in prices is evident across other asset classes – the US10yr treasury yield downtrend that began from the Oct.’18 peak of 3.262% remains incomplete, requiring another but final decline to lower-lows, below last September’s low of 1.429%. Also, U.S. stock markets are set to end last October’s uptrend – those gains of +16% per cent must be corrected to the downside…Various Base Metal Mining stocks are set to trade lower over the next few months too. The US$ dollar could flip higher for a few months, indicating the same risk-off event…’.
Commodities and Coronavirus Aftermath
These forecasts were realised as the coronavirus pandemic spread from China, across continental Europe and later to the United States. There was no contemplation at the time that the COVID-19 pandemic would be the catalyst for the expected declines across commodity markets. However, Elliott Wave patterns were already warning of a significant sell-off.
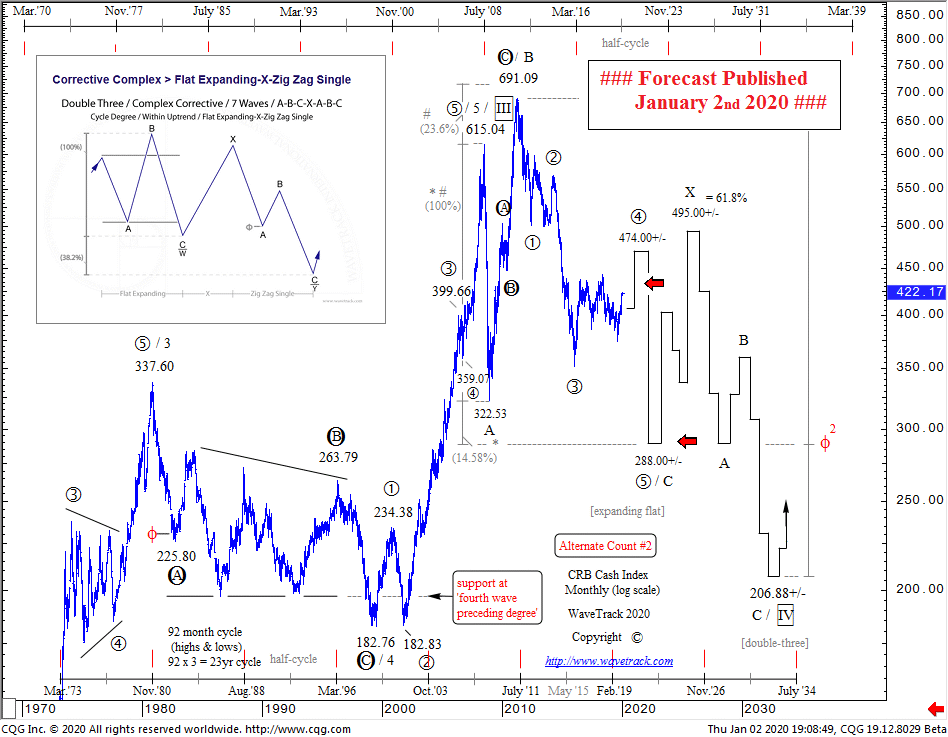
Fig #1 – Track Record – CRB Cash Index – 2nd January 2020 by WaveTrack International
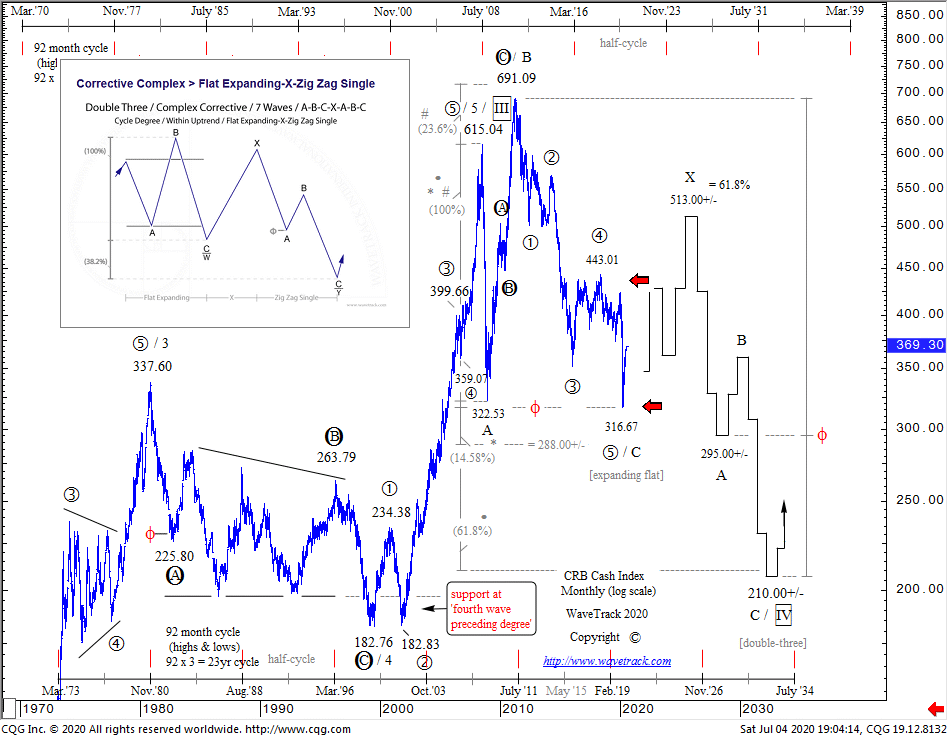
Fig #2 – Result! – CRB Cash Index – 2nd January 2020 by WaveTrack International
Price declines were even more severe that these bearish forecasts. Copper declined by -30% per cent. Crude/Brent oil collapsed by an unprecedented -90% per cent whilst industrial precious metal fell by -40% per cent. Even gold wobbled! And traded down -15% per cent into March’s low. Stock markets declined by -35% per cent whilst the US10yr yield traded down to historical lows of 0.378% per cent.

Fig #3 – Track Record – MSCI EM and Copper Correlation Study – 4th January 2020 by WaveTrack International
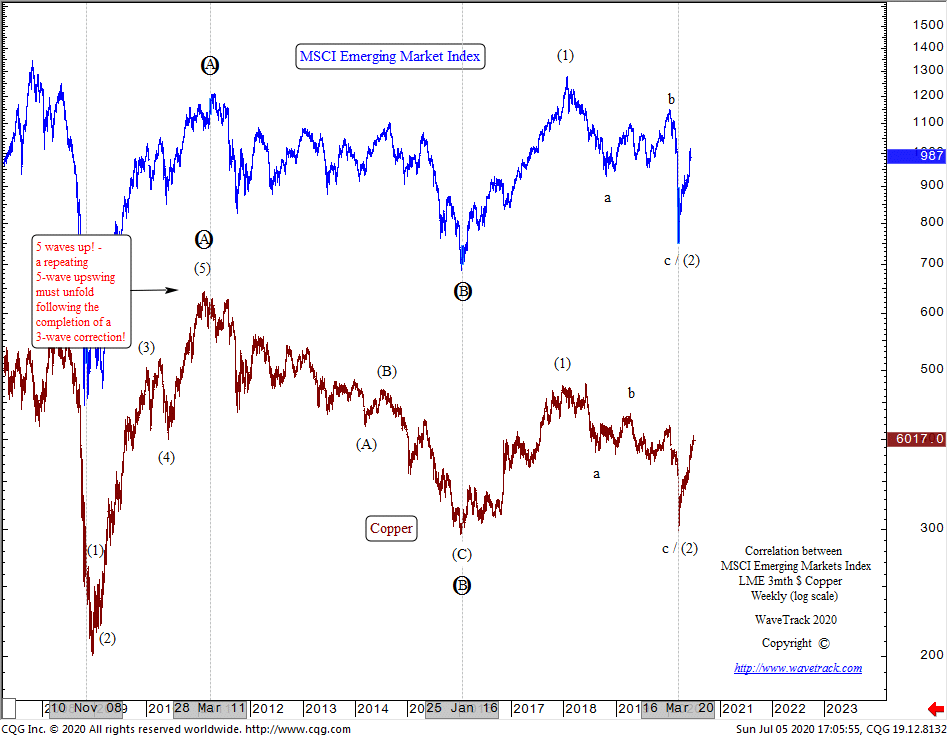
Fig #4 – Result! – MSCI EM and Copper Correlation Study by WaveTrack International
Commodities and V-Shaped Recovery
Commodities have certainly undergone a V-shaped recovery since forming important lows last March. Despite warnings of a second-wave of coronavirus infections spreading across the U.S. and South America, this is unlikely to lead to prices trending below last March’s lows. Base metals ended major corrective lows as did industrial precious metals together with Crude/Brent oil.
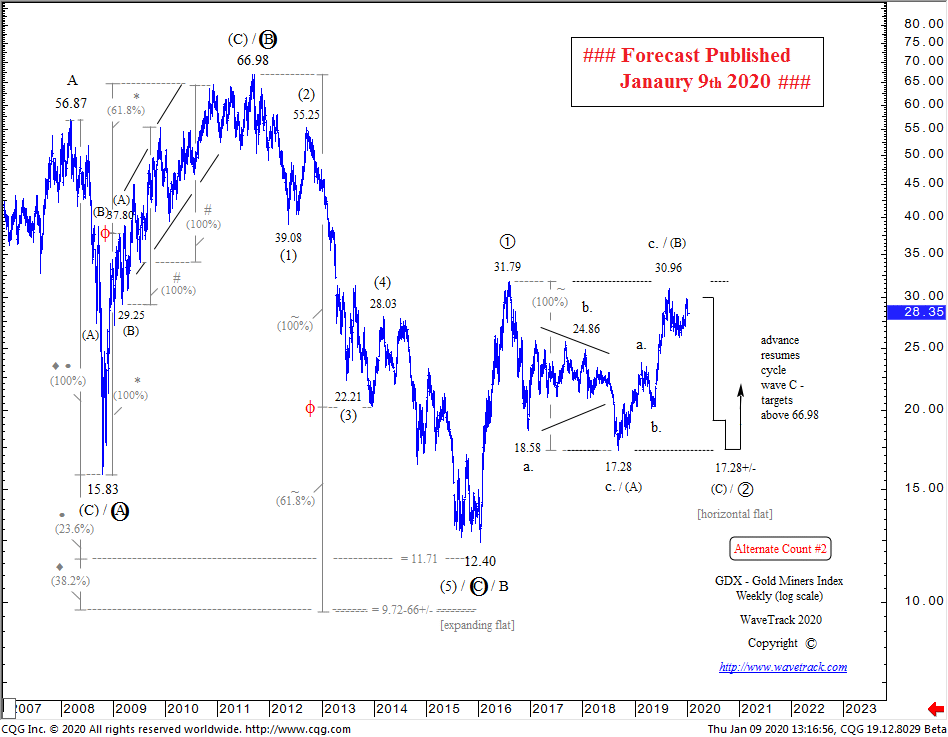
Fig #5 – Track Record – GDX – Gold Miners Index – 9th January 2020 by WaveTrack International

Fig #6 – Track Record – Crude Oil – Count #2 – 9th January 2020 by WaveTrack International
Aftermath of Coronavirus Sell-Off
V-shaped recoveries have begun from March’s lows and these are sustainable uptrends that are forecast unfolding over the next 2-3 years. But commodity trends don’t head higher in straight lines but are instead punctuated by intervals of corrective declines. Price advances are reaching interim upside targets right now.
New Commodities Mid-Year 2020 Video – PART II/III
We’ve amassed over 75 commodity charts from our EW-Forecast database in this mid-year 2020 video. Each one provides a telling story into the way Elliott Wave price trends are developing in this next INFLATION-POP’ phase of cycle development. We’re taking a look at some very specific patterns that span the entire SUPER-CYCLE, explaining why the super-cycle began from the GREAT DEPRESSION lows of 1932 and not from the lows of 1999 and how this ended in 2006-2008 and why the multi-decennial corrective downswing that began soon afterwards has taken the form of a very specific, but identifiable Elliott Wave pattern into the COVID-19 lows.
We invite you to take this next step in our financial journey with us. Video subscription details are below. Just follow the links and we’ll see you soon!
Most sincerely,
Peter Goodburn
Founder and Chief Elliott Wave Analyst
WaveTrack International
Commodities Video Part II
Contents: 78 charts
Time: 2 hours 10 mins.
• CRB-Cash index
• US Dollar index + Cycles
• Copper + Cycles
• Aluminium
• Lead
• Zinc
• Nickel
• Tin
• XME Metals & Mining Index
• BHP-Billiton
• Freeport McMoran
• Antofagasta
• Anglo American
• Kazakhmys Copper
• Glencore
• Rio Tinto
• Teck Resources
• Vale
• Gold + Cycles
• GDX Gold Miners Index
• Newmont Mining
• Amer Barrick Gold
• Agnico Eagle Mines
• AngloGold Ashanti
• Silver + Cycles
• XAU Gold/Silver Index
• Platinum
• Palladium
• Crude Oil + Cycles
• Brent Oil
• XOP Oil and Gas Index
BUY NOW on WaveTrack’s VIMEO Video On Demand Page
Click here to buy the COMMODITIES Mid-Year Video Update 2020
*(additional VAT may be added depending on your country – currently US, Canada, Asia have no added VAT but most European countries do)
We’re sure you’ll reap the benefits – don’t forget to contact us with any Elliott Wave questions – Peter is always keen to hear you views, queries and comments.
Visit us @ www.wavetrack.com
We’re sure you’ll reap the benefits. Don’t forget to contact us with any Elliott Wave questions. Our EW-team is always keen to hear your views, queries, and comments.
Visit us @ www.wavetrack.com
Comments
Leave a Reply

Recent Posts
Recent Comments
Archives
- June 2025
- March 2025
- February 2025
- January 2025
- December 2024
- August 2024
- July 2024
- June 2024
- May 2024
- April 2024
- February 2024
- January 2024
- December 2023
- August 2023
- July 2023
- June 2023
- March 2023
- February 2023
- January 2023
- December 2022
- November 2022
- October 2022
- August 2022
- July 2022
- June 2022
- May 2022
- March 2022
- February 2022
- January 2022
- December 2021
- August 2021
- July 2021
- June 2021
- March 2021
- February 2021
- January 2021
- December 2020
- November 2020
- August 2020
- July 2020
- June 2020
- May 2020
- April 2020
- March 2020
- February 2020
- January 2020
- December 2019
- October 2019
- September 2019
- July 2019
- June 2019
- May 2019
- April 2019
- March 2019
- February 2019
- January 2019
- December 2018
- November 2018
- September 2018
- August 2018
- July 2018
- June 2018
- May 2018
- April 2018
- March 2018
- February 2018
- January 2018
- December 2017
- November 2017
- October 2017
- September 2017
- August 2017
- July 2017
- June 2017
- May 2017
- March 2017
- February 2017
- January 2017
- December 2016
- November 2016
- October 2016
- September 2016
- August 2016
- July 2016
- June 2016
- May 2016
- April 2016
- March 2016
- February 2016
- January 2016
- December 2015
- November 2015
- October 2015
- September 2015
- August 2015
- July 2015
- June 2015
- May 2015
- April 2015
- March 2015
- February 2015
- January 2015
- December 2014
- November 2014
- October 2014
- September 2014
- August 2014
- July 2014
- June 2014
- May 2014
- April 2014
- March 2014
- February 2014
- January 2014
- December 2013
- November 2013
- October 2013
- September 2013
- August 2013
- July 2013
- June 2013
- May 2013
- April 2013
- March 2013
- February 2013
- January 2013
- December 2012
- November 2012
- October 2012
- September 2012
- August 2012
Categories
- ADXY Index
- Agnico Eagle Mines
- Alcoa
- Amazon
- AngloGold Ashanti
- Antofagasta
- APPL
- Apple
- ASX 200
- AUD vs USD
- AUDNZD
- AUDUSD
- Australia ASX 200
- Baltic Dry Index
- Banking
- Base Metals
- Biotechnology
- Bitcoin
- Bovespa
- Broadcom
- Catalexit
- central banks
- Christmas
- Commodities
- Commodities Video Outlook 2020
- Conference
- Copper
- Coronavirus Sell-Off
- CRB
- Crude oil
- crude oil price chart
- CryptoCurrency
- Currencies
- Currencies + Interest Rates Video Outlook
- Cycles
- Dax 30
- deutsche bank
- Dewey Cycle
- DJ Transportation Average
- DJ Utilities
- Dow Jones 30
- Dow Theory
- ECB
- economy
- Elliott Wave
- Elliott Wave Charts
- Elliott Wave Patterns
- Elliott Wave Principle
- Emerging Markets
- Ending-Diagonal Elliott Wave Pattern
- Equity
- EUR vs CHF
- EUR/USD
- Euro / US$
- Eurostoxx 50
- EuroStoxx50
- EuroStoxxBanks
- EURUSD
- Expanding Flat Pattern
- FAAMG
- FANG+
- fib-price-ratio
- Fibonacci Trading
- Fibonacci-Price-Ratio
- Financial Forecasting
- Fixed Income
- forex
- Freeport McMoran
- FTSE 100
- Fund Management
- FX
- FXStreet
- GBP/AUD
- GBP/USD
- GDX
- GDXJ
- Germany 10 year Euro Bund future
- Gilead Sciences
- Glencore
- Global Economy
- Gold
- Gold Mining
- Golden Ratio
- goldman sachs
- Google Inc.
- Google/Alphabeth
- Greek debt crisis
- Hang Seng
- Harbinger
- Hungarian Forint
- IBEX 35 Index Spain
- Independent Research
- India-CNX Nifty 50
- Interest Rates
- Interview
- IRP Independent Research
- kbw bank index
- Lonmin
- McDonald's
- MID-YEAR VIDEO UPDATE!
- Mifid II
- Mines
- Mining
- MSCI China
- MSCI Emerging Markets
- Nasdaq 100
- Nasdaq Biotechnology Index
- Nasdaq Composite
- Nasdaq100
- Netflix
- Newmont Mining
- Nikkei 225
- NVIDIA
- NYSE Composite Index
- Palladium
- Platinum
- Precious Metals
- Ralph Nelson Elliott
- Reversal-Signature
- Russell 2000
- Russia RTS
- S&P 500
- Sector
- Secular-Bull
- Sentiment Survey
- Shanghai Composite Index
- Silver
- Slanting Flat Elliott Wave Pattern
- SP100
- SP400 Mid-Cap
- SP500
- SPX 500
- STLG/AUD
- Stlg/US$
- STLG/USD
- STLG/YEN
- STLG/ZAR
- Stock Index
- Stock Index Tracking
- Stock Index Video
- Stock Indices
- Stock Indices Video Outlook 2023
- Stock Indices Video Outlook 2025
- Sugar
- Summary
- Tesla
- Tesla Inc
- Toyota
- Track Record
- trading
- Trusts
- Tutorial
- Uncategorized
- UniCredit
- US
- US Dollar Index (DXY) (USDX)
- US$ Index
- US-Dollar Index
- US10yrYields
- USD
- USD/ARS
- USD/CNY
- USD/IDR
- USD/INR
- USD/MXN
- USD/SGD
- USD/THB
- USD/YEN
- USD/ZAR
- Vale
- Value Line Index
- video
- VIDEO OUTLOOK 2018
- VIDEO OUTLOOK 2020
- VIX
- W.D. Gann
- WaveTrack International
- XAU Gold/Silver Index
- Xetra Dax
- XOP
- Yields
- Zig Zag
- Zinc
- ‘INFLATION-POP’
- ‘SHOCK-POP-DROP’