Elliott Wave Theory Bullish – Dow Theory Bearish
by WaveTrack International| November 27, 2018 | 6 Comments
Dow Theory vs. Elliott Wave Theory
The Dow Jones Transportation Average (DJTA) versus the DJ Industrial Average (DJIA) has been a much-watched pairing for Dow Theorists in ascertaining bullish/bearish divergences and the direction of the overall market. In a note posted in MarketWatch today, analysts have cited the likelihood of a new bearish signal if the DJ Transportation Average closes below its late-October low. This is because the DJ Industrial Average has already closed below its equivalent late-October low on Nov. 23rd. It must be emphasised that analysts use the closing levels to compare divergence, not intra-day lows. Basis the Dow Theory, a DJTA close below 9896.10 would trigger a new sell signal.
How is Elliott Wave Theory solving the problem?
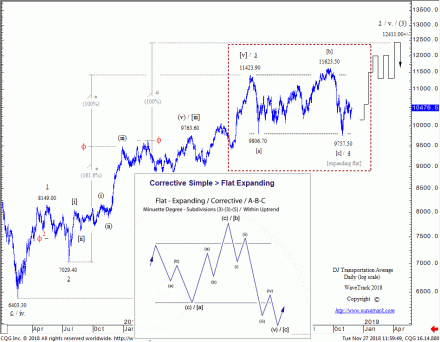
But from an Elliott Wave Theory perspective, the DJTA has already triggered a new ‘buy’ signal in late-October at its intra-day low of 9757.50 because this has been identified as ending the expanding flat pattern that originated from last January’s high of 11423.90 – see fig #1.
The expanding flat is highlighted in the red-rectangle – compare this to the tutorial pattern (bottom-centre) – they are exactly the same. The expanding flat pattern is labelled minute wave 4 within the impulse uptrend that began from the Feb.’16 low. It is a correction within the existing, developing uptrend, composed of three price-swings, labelled [a]-[b]-[c], subdividing 3-3-5.
Note how the February-October upswing labelled wave [b] unfolds into a required three price-swing sequence, i.e. a zig zag. It was also required to penetrate the January peak by a modest fake-out, then decline rapidly into a five wave pattern for wave [c], breaking modestly below February’s low. All these conditions were fulfilled.
Sentiment
Bearish sentiment is fairly extreme at the moment, providing a contrarian bullish signal. Investors Intelligence show Bulls fell to 39.6 from 42.9 and that is the least since May 2016. Bears were up by 0.8 pts to 19.8. The Daily Sentiment Index on the S&P 500 and NASDAQ has declined to only 8.0 which translates into 92% per cent being bearish. AAII of Individual Investor Sentiment shows the Bears jumped 11.2 per cent to 47.1 per cent, the highest figure since February 2016 whilst Bulls fell by 9.8 per cent to 25.3 per cent the lowest number since August 2017.
Conclusion
It may take longer for Dow Theorists to identify the anticipated bearish signal is actually a bullish divergence that is already signalling the resumption of the larger/aggregate uptrend. New record highs are forecast from Elliott Wave Theory over the next several months into H1-2019.
To subscribe, click here:
Institutions – more information
Private Investors – subscribe
Comments
6 Responses to “Elliott Wave Theory Bullish – Dow Theory Bearish”
Leave a Reply


November 27th, 2018 @ 6:12 pm
Dear EWT team,
I have a EW question.
In an expanding flat (a-b-c, 3-3-5), ‘c’ is supposed to go below ‘a’ to complete the pattern.
My questions are –
1. What if ‘c’ doesn’t go below ‘a’, but stays higher than an end point of ‘a’. Is it allowed in EW? For example, in October 2018, India’s NIFTY didn’t go below the bottom of March 2018, but came very close to it. In such a case, should we wait for ‘c’ to go below ‘a’ to complete the expanding flat pattern or in there are exceptions to this rule?
2. If exception rule is not there, should we consider that developing pattern is NOT an expanding flat and something else?
Please let me know your views.
Thanks in advance.
With Regards,
November 27th, 2018 @ 6:45 pm
Hello Praveen Vishnu Shamain, Thank you for the great question!
ANSWER: When a five wave decline unfolds in wave ‘c’ of an expanding flat which doesn’t break below the low of wave ‘a’, then this pattern is called a ‘running flat’ – this occurred for the Nifty 50 into the late-October low – see fig #6a, bottom-right here: https://goo.gl/Ka3giB – Wishing you a wonderful day!
November 28th, 2018 @ 3:29 am
Thank you very much.
It means, in a practical / live market, we will not be knowing whether the pattern is – an ‘expanding flat’ or a ‘running flat’, till we get “5 waves bounce” from that point. Am I right?
Thanks once again for educating your followers.
GOD bless you guys.
With Regards,
November 28th, 2018 @ 10:06 am
You are most welcome and thank you for your kind words. In answer to your question the first clue that a running flat is completing the pattern rather than an expanding flat is where wave [c] subdivides into a five wave impulse ending above wave [a]’s low. This five wave pattern needs to be ‘measured’ according to WaveTrack’s fib-price-ratio methodology to ensure validity. And as you correctly say, the next aspect is to see if an intra-hourly five wave upswing follows from the terminal 5th low of wave [c]…then buy on retracements. Hopefully, this helps and most of all have a wonderful day!
December 3rd, 2018 @ 9:08 am
DJI/SPX three waves up, three waves down retracing 90%, five waves up to the high where the pattern has begun.
Wondering what kind of pattern this is?
No no November was not just a flat correction, something very bullish has begun:)
December 7th, 2018 @ 7:32 am
DJT posible 1-2 or 1-2 i-ii destroyed, zig-zag higher and impulse lower… I am shocked:) Now what?
Wait I am so stupid 1 and 2 as expanded flat of course:))))