DOW THEORY & ELLIOTT WAVE
by WaveTrack International| October 17, 2017 | No Comments
Dow Jones Industrials vs DJ Transportation Average
In recent media commentaries, analysts have been warning of an Armageddon collapse in stock markets because CAPE and P/E ratios are so historically high. What they seem to forget is that highs can go even higher! There doesn’t seem to be the same public euphoria that accompanied primary wave 3’s peak into the dot.com highs of March 2000. Neither is Dow Theory offering any bearish divergences at this stage of the secular-bull uptrend.
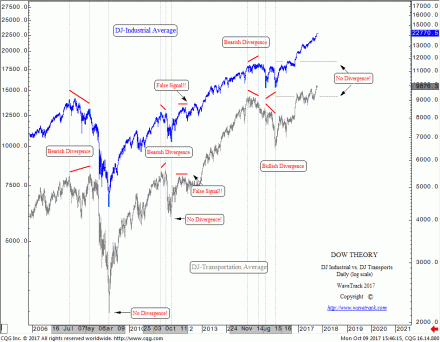
In this next chart, we examine Dow Theory’s concept of bullish/bearish divergences between the Dow Jones Industrial Average and the DJ-Transportation Average at key turning points – see fig #1. Dow Theorists will differ in their ‘trigger’ points in activating a buy or sell signal, but this is predicated on a preceding divergence or out/underperformance between these two indices. In order for a trend to be established, Charles Dow postulated that indices or market averages must confirm each other. If they differ at higher-highs, or lower-lows, then the trend may be in a process of ending. As you can see, both indices are trading into higher-highs, simultaneously. There are no divergences with either one lagging behind the other which would indicate underperformance, or weakness. Instead, both are confirming the overall markets uptrend.
Notable lagging or bearish divergences occurred prior to the 2007 financial-crisis and even in the minor corrections in 2011 and 2015-15 but not now. That’s good news for the foreseeable future, but what this doesn’t tell us is if there is a dual corrective decline around the corner!
Elliott Wave Analysis
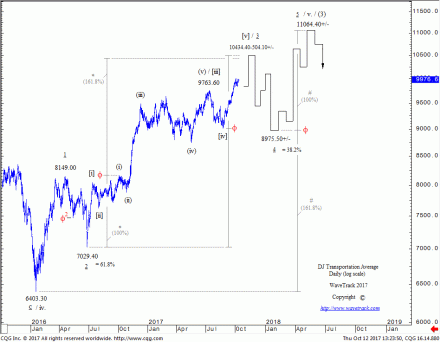
The DJ-Industrial Average forecasts are in exact sync with the S&P 500. From what we can see, it is the same rhythm in the DJ-Transportation Average – see fig #2. Bottom-left is the low at the grand ‘Re-Synchronisation’ lows of Feb.’16 at 6403.30. A five wave pattern uptrend has since unfolded as minor wave v. five. Exactly the same degree of trend (nomenclature) as the S&P 500 and DJIA! The Transports is also approaching a terminal 3rd wave high within this uptrend. Here Fibonacci-price-ratio targets are measured towards 10434.40-10504.10+/-. These levels are derived from Fibonacci-price-ratio measurements within minute wave 3’s advance that began from the June ’16 Brexit low of 7029.40.
Once completed, minute wave 4 will begin a multi-month corrective decline lasting into year-end. Downside targets are towards the fib. 38.2% retracement area at 8975.50+/- (log scale). Extending this from the origin of wave 1 projects an ultimate high for wave 5 towards 11064.40+/- due sometime into the end of Q1’18.
Summing Up
The roles of Dow Theory (DT) and Elliott Wave Theory (EWT) differ. Dow Theory relies on the divergence effect at major peaks and troughs. Whereas EWT is a methodology tracking the seamless, sequential progress of price development. Both have their uses but are used quite differently.
With no obvious underperformance between the Dow Jones Industrials and the DJ-Transportation Average, we see no reason for supporting a major collapse as CAPE and P/E indicate. The Dow Jones Transportation Average is unfolding in sync with its major contemporaries.
Ensure you’re tracking our forecasts subscribe online for the EW-COMPASS REPORT.
Visit us @ www.wavetrack.com and subsribe to our latest EW-COMPASS report!
Check out WaveTrack’s latest CURRENCY VIDEO @ CURRENCIES and INTEREST RATES VIDEO PART III and subsribe to our latest EW-COMPASS report!
Comments
Leave a Reply


