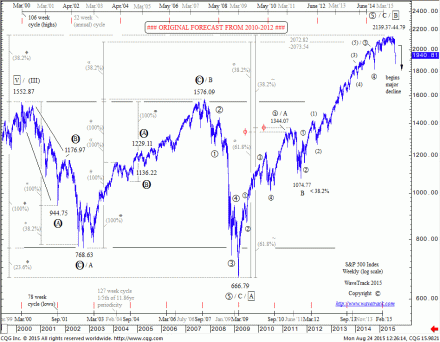
Critical moment for the S&P 500 index
by m.tamosauskas| August 24, 2015 | 4 Comments
Our long-term subscribers may recall our original S&P 500 forecast from 2010-2012. We plotted a developing cycle degree, three price-swing zig zag advance unfolding from the financial-crisis lows of 666.79. Ultimate upside targets were measuring two key levels – 2139.37 and 2144.79. THE MAY ’15 HIGH WAS 2134.72! This measurement is dependent on the advance being a zig zag – such accuracy means we cannot entirely eliminate the possibility that the next stage of the multi-decennial expanding flat pattern is about to begin its next downswing as super-cycle wave C. The next several months will be critical in determining the longer-term picture. Join us and let’s explore the Elliott Wave Universe together!
Comments
4 Responses to “Critical moment for the S&P 500 index”
Leave a Reply


August 24th, 2015 @ 6:26 pm
Does it mean that you are giving up on your much publicised view/scenario of “Inflation Pop-up” in the world equity/commodity markets?
Thanks,
August 24th, 2015 @ 7:13 pm
Hi Praveen, not entirely true, but the risk is increasing!
December 2nd, 2015 @ 7:34 pm
My method, though it is based on Elliott Wave and Fibonacci is not capable of price projections per se, but does produce ‘hidden’ trendlines. My method agrees with yours… I make math derived changes in the X-axis, time, and unique trendlines ‘pop’ out.
December 3rd, 2015 @ 5:46 pm
if you feel able to, please elaborate your technique!…thks!