Apple Inc. – Right on Target!
by WaveTrack International| September 24, 2018 | 2 Comments
Apple Inc. Hits Upside Targets of 228.42+/- Then Stages Reversal-Signature!
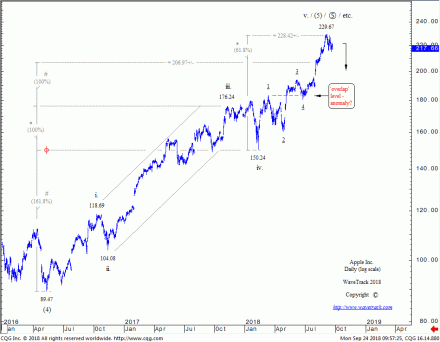
The August 3rd update of Apple Inc. forecast upside price acceleration following the publication of strong quarterly earnings results. Elliott Wave analysis had identified this latest push to record highs as a concluding 5th wave within the five wave impulse pattern unfolding higher from February’s low of 150.24. But this was minor wave v. five within the larger impulse uptrend. This wave dates back to the May ’16 low of 89.47, labelled intermediate wave (5) which means a much larger uptrend was approaching completion.
Using fib-price-ratios, Apple Inc. was forecast higher from 207.39 ending minor wave v. five at 228.42+/-. The actual test of this price level occurred on September 5th at 229.67. It was derived where minor wave v. five unfolds by a common fib. 61.8% correlative ratio of waves i-iii one-three.
Since achieving this upside target for wave v. five of (5), Apple Inc. has now staged price-rejection. The subsequent reversal-signature confirms that a counter-trend decline has begun.
What Next?
The next question is how far can Apple Inc. decline in this correction? Intermediate wave (5)’s advance from the May ’16 low was also the concluding 5th wave of primary wave 5. It stretches back to the April ’13 low of 55.01. And primary wave 5 is also part of the longer-term impulse uptrend that began from the July ’82 low of 0.19. If correct, then Apple Inc. could begin a major correction lasting a decade or more. Returning prices back to low-double-digit levels! But is this likely at this juncture of the secular-bull uptrend? After all, the Nasdaq 100 is still some way off Elliott Wave upside targets of 11946.00+/- (see bi-annual video series).
Apple Inc. – Alternate Counts
Although Apple Inc.’s historical data begins in December 1980, this isn’t enough to verify an absolute terminal price-peak for ending its long-term uptrend. Major indices bottomed in 1974, six years earlier so we can only guess what Apple Inc. would have traded then. It makes a huge difference in Fibonacci-Price-Ratio measurements of the secular-bull uptrend and of course, the Elliott Wave pattern itself.
The current long-term wave analysis is therefore one of a few potentialities labelling primary wave 1 ending into the April ’91 high of 2.61, primary wave 2 into the Dec.’97 low of 0.45, primary wave 3 ending into the Sep.’12 high of 100.72 and now primary wave 5 completing in Sep.’18 at 229.67.
But what we can determine with some surety is that a five wave impulse upswing from the May ’16 low of 89.47 did end into the early-September high of 229.67 which at the very least, indicates a corrective retracement towards ‘fourth wave of preceding degree’ which is at the Feb.’18 level of 150.24.
One alternate count that prolongs Apple Inc.’s secular-bull uptrend relabels the intermediate degree subdivision of primary wave 5’s advance from the April ’13 low of 55.01 so that wave (1) ends into the April ’15 high of 134.54, wave (2) into the May ’16 low of 89.47, wave (3) into the Sep.’18 high of 229.67 with wave (4) now engaged in a corrective downswing towards the fib. 38.2% retracement level of 160.00+/-. Naturally, this decline would necessitate unfolding into a three wave pattern, or a multiple seven/eleven wave sequence to validate its corrective credentials so would be easily spotted and differentiated to a more bearish impulse pattern.
Conclusion
Apple Inc. has underperformed over the last weeks. In fact, coming bottom of the Dow Jones 30 index table of component stocks. Apple reached a decline of -2.8% per cent over the last week alone and down -6.25% per cent from the high. This is consistent action following the completion of the 5th wave at 229.67. However, it’s too early to verify Apple Inc.’s long-term consequences. This means for the time being, downside targets are at least towards the 160.00+/- area.
Are you trading the SP500, EuroStoxx, Nasdaq 100, Russell 2000, Dow Jones 30, Dax, FTSE100 or ASX200? Don’t miss WaveTrack’s regular updates in our bi-weekly EW-Compass Report! Ensure you’re tracking our Forex forecasts – subscribe online for the EW-COMPASS REPORT.
Visit us @ www.wavetrack.com and subsribe to our latest EW-COMPASS report!
Comments
2 Responses to “Apple Inc. – Right on Target!”
Leave a Reply


September 25th, 2018 @ 5:30 pm
So if ratio and proportion were applied here it appears as though the 160 level should be reached in the next 6-9 months if not 4-6… True or not? TIA for the great work analysis!
September 26th, 2018 @ 9:10 am
Yes, 160.00+/- is certainly a heightened probability within the time-frame you mention. But remember, any thrust above 229.67 would otherwise postpone the corrective downswing and instead prolong minor wave v. five’s advance from 150.24…next upside targets would be towards 267.95+/-, derived by extending minor waves i-iii by a fib. 61.8% ratio. Very best wishes!