Alcoa equity Elliott Wave Update
by m.tamosauskas| April 4, 2015 | 2 Comments
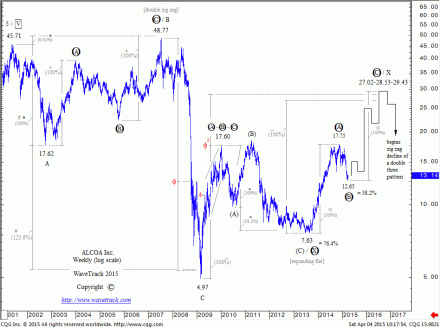
Back in 2013, Alcoa was recognised as completing its counter-trend decline from the Jan.’10 high of 17.60 into the July ’13 low of 7.63 whilst unfolding into an expanding flat pattern. This represents wave ‘X’ within a larger double zig zag advance that began from the March ’09 low of 4.97: http://goo.gl/gEgF15 .
A reversal signature to the upside confirmed this forecast and prices doubled in a little bit more than a year:
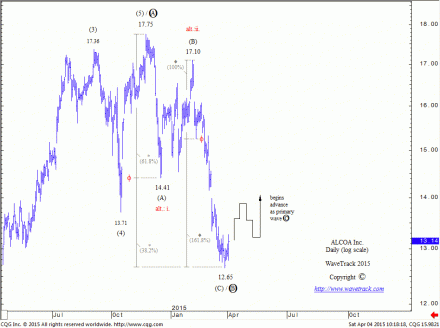
It has slightly exceeded our ideal interim upside targets with a recorded high at 17.75 in Nov.’14 but since then has gradually underperformed its benchmark S&P 500 index and currently trades -25% down from the 17.75 high – a fib. 38.2% retracement level of the preceding advance. A closer look reveals a three wave sequence has unfolded with 61.8%/38.2% correlation ratio within this decline:
The minimum requirement has been achieved and we do believe Alcoa might be in its early stages of final advance towards new recovery highs. Ultimate upside targets are updated to 27.02-28.53-29.43 basis various fib-price-ratio measurements (see fig #1). Another price doubling during the next few years? Our Elliott Wave analysis suggests it’s the most probable outcome!
Comments
2 Responses to “Alcoa equity Elliott Wave Update”
Leave a Reply


September 10th, 2019 @ 6:42 pm
Hi. I’m interested in this equity. Are you going to give an updte about it? Thanks in advance
September 18th, 2019 @ 10:40 am
Hi Fran. No immediate update, but our EW-team has taken a quick look at it seems a five wave impulse downswing from the April ’18 high of
62.35 ended late-August at 16.46 – a deep counter-trend upswing lasting the next 12-18 months would fit our ‘Inflation-Pop’ forecasts. Hope this helps and have a great day!