Commodities Video 2020 – Q1 Sell-Off – Lift-Off Q2!
by WaveTrack International| January 18, 2020 | No Comments
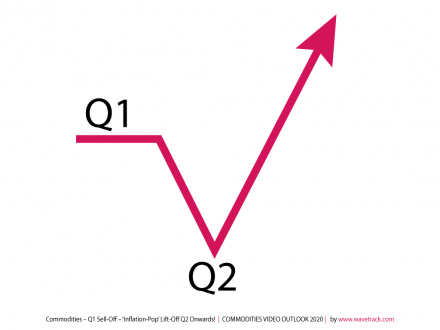
Commodities – Q1 Sell-Off – ‘Inflation-Pop’ Lift-Off Q2 Onwards!
THIS REPORT INCLUDES ANALYSIS ON MEDIUM-TERM CYCLES & EQUITY MINERS
We’re pleased to announce the publication of WaveTrack’s annual 2020 video updates of medium-term ELLIOTT WAVE price-forecasts. Today’s release is PART II, COMMODITIES – Part I was released last month and Part III will be published in early-February.
• PART I – STOCK INDICES – out now!
• PART II – COMMODITIES – out now!
• PART III – CURRENCIES & INTEREST RATES – coming soon!
Elliott Wave Forecasts for 2020 – Summary
Q1 Sell-Off – ‘Inflation-Pop’ Lift-Off Q2 Onwards!
Secular-bull uptrends in U.S. stock markets that resumed from the financial-crisis lows of 2008/09 are intimately linked to the corresponding price advances in commodity markets. Despite comparable uptrends from those 2008/09 lows, from an Elliott Wave perspective, the definition of an uptrend doesn’t apply to many commodities, whether they’re Base Metals, Precious Metals or Energy contracts like Crude/Brent Oil.
Whereas U.S. stock markets are still engaged in long-term five wave impulse uptrends that began from the Great Depression lows of 1932, Elliott Wave analysis identifies Base Metals and Energy contracts ending their corresponding Commodity Super-Cycle peaks much earlier, in year-2006/08. Everything that has so far followed is part of a multi-decennial corrective pattern, specifically, an A-B-C expanding flat where wave B allows a push to new record highs. Those B wave advances correspond to 5th wave advances in U.S. stock markets.
Back in year-2010, we termed this B wave advance as the ‘Inflation-Pop’ cycle because it was destined to trigger several years of rising inflationary pressures, as asset prices were driven higher by central bank’s monetary policy and quantitative easing measures. Fast-forward to 2020, those rising inflationary pressures are about to get another kick higher.
Commodities and US$ Dollar Outlook
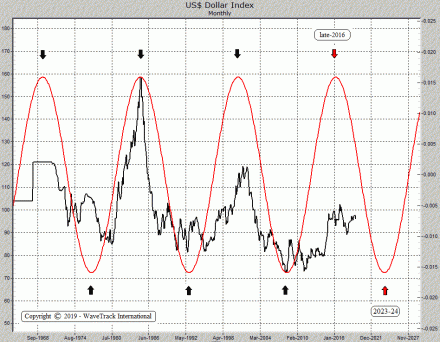
One contributor that’s expected to drive asset values significantly higher over the next few years is a weakening US$ dollar – see fig #1. There’s a distinct 15.6-year cycle recurrence for the US$ dollar index which has signalled the various peaks and troughs over the past several decades.
The last time the cycle peaked was late-2016 when the US$ dollar index traded to a high of 103.82. This is a centrally-translated cycle where peaks and troughs alternate in similar time-intervals of 7.8-years which means the late-2016/early-2017 cycle downturn will last approximately 7.8-years into the next 15.6-year cycle trough due in years 2023/24.
Basis Elliott Wave analysis dating back to the historical peak of 164.72. This puts the dollar on a crash-course for declines below pre-financial-crisis lows!
Commodities and Interest Rate Outlook
Another contributor to rising inflationary pressures will be the triggering of a new uptrend in interest rates.
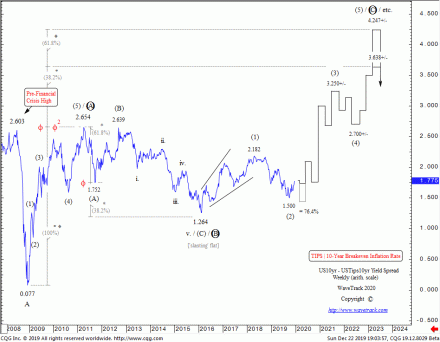
The US10yr Breakeven Inflation Rate (TIPS) yield is nearing the completion of a counter-trend downswing that began in early-2018 – see fig #2. This correction was forecast in the 2018 annual Interest Rate report – ‘The recent break for the US10yr treasury yield above the 2017…indicates further upside potential into the end of Q1 ’18, beginning of Q2 targeting 3.360+/-…Once completed, a multi-month corrective decline would then begin, pulling yields sharply lower…The US10yr TIPS Breakeven Inflation Rate Spread indicates an interim peak forming at the same time as treasury yields…This suggests worries over the re-emergence of inflationary pressures will abate for a while…’. – a while has turned out to be almost 2-years!
Ten-year treasury yields are expected to undergo another downswing into Q1 2020 before forming an historical base, then trending higher to begin a new 30-year cycle. This could pull the US10yr Breakeven Inflation Rate (TIPS) yield slightly below current levels of 1.500 although only marginally, before trending higher too. The outlook over the next few years is amazing! Upside targets are towards 4.247%!! We’ll explain more in PART III of the annual report, but until then, suffice to know that a primary degree A-B-C zig zag pattern has been unfolding since the end of the financial-crisis of 2008/09.
Rising Food & Agriculture Prices
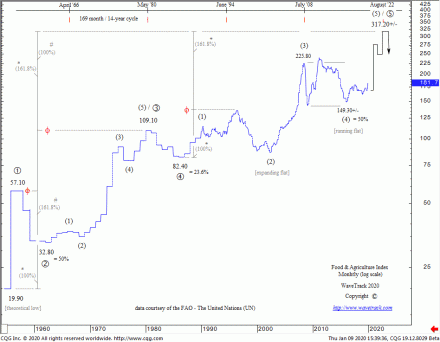
Whilst this annual 2020 Commodities report doesn’t include analysis of grains and soft commodities, we can get an overview of trends from studying the Food and Agriculture Organization (FAO) price index – see fig #3.
The historical data begins from the 1950’s – there’s a clearly defined Elliott Wave impulse pattern, a primary degree five wave impulse sequence, 1-2-3-4-5 engaged to the upside. This multi-decennial uptrend began primary wave 5 from the June ’86 low of 82.40. It has steadily advanced since, subdividing into an intermediate degree uptrend, (1)-(2)-(3)-(4)-(5) where wave (5) began lifting prices higher from the grand ‘Re-Synchronisation’ lows of early-2016, from 149.30.
Food and Agriculture Organization Index
In the last month, the Food and Agriculture Organization (FAO) reported the index, which measures monthly changes for a basket of cereals, oilseeds, dairy products, meat, and sugar jumped to its highest point since Dec.’14, averaging 181.7 points, up 2.5% on the previous month.
The cereal price index rose 1.4% to average 164.3 points, led by higher prices for wheat with stronger demand from China and logistics problems following strikes in France. Rice prices were little changed. Vegetable oil prices were up strongly, with the index rising 9.4% to 164.7 points in December. Palm oil prices rose for the fifth month in a row, lifted by biodiesel demand, while soy, sunflower, and rapeseed oil values also increased.
The dairy price index averaged 198.9 points in December. Precisely, up 3.3% with higher cheese and skim milk powder prices that outweighed lower butter and whole milk powder values. The sugar price index was up 4.8% to 190.3 points, lifted by surging demand for ethanol caused by rising crude oil prices.
By contrast, meat prices were almost unchanged from November with the meat price index at 191.6 points with higher pig and sheep meat prices balanced by falling beef prices.
But what does this tell us? Well, from an Elliott Wave perspective, there’s a long way to go before reaching intermediate wave (5)’s ultimate upside target of 317.20+/-. That can only mean one thing – rising prices = rising inflationary pressures.
Q1 Sell-Off!
Before commodity prices launch higher, we expect Base Metals & Energy to trade lower during the first-quarter Q1-2020 period.
Base metals like Copper etc. haven’t quite finished Elliott Wave corrections that began from the early-2018 peaks. Crude/Brent Oil began a three wave, A-B-C corrective downswing from the Oct.’18 highs of $76.90 and $86.74. However, wave C remains in downside progress. This can only suggest some form of economic deterioration. A possible weakness for the first few months of 2020, pulling commodity prices lower to finalise these 2018 corrections.
Commodities and the Baltic Dry Index
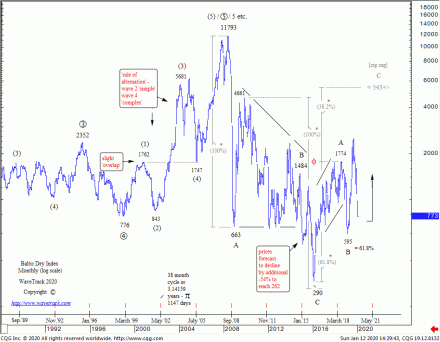
One leading indicator worth tracking for signs of an economic downturn is London’s Baltic Dry Index (BDI) – see fig #4. The historical data begins from the late-1980’s. It tracks rates for capesize, panamax and supramax vessels that ferry dry bulk commodities around the world. The BDI began a new uptrend from the grand ‘Re-Synchronisation’ lows of early-2016, from 290.00. Elliott Wave analysis forecasts this advance beginning a decennial A-B-C zig zag upswing. Wave A ended an initial advance into the July ’18 high of 1774.00 – wave B completed a counter-trend decline into the Feb.’19 low and wave C is now engaged in a multi-year five wave uptrend targeting levels towards 543.00+/-. That’s a huge gain over the next several years, reflecting an increase in shipping goods around the world, ergo, rising inflationary pressures.
But in the last couple of months, a deep 2nd wave correction has unfolded within wave C’s five wave uptrend. It began from the Sep.’19 high of 2442.00 and is still heading lower – so far, a low into early-January of 773.00 reflects a decline of -69% per cent. If this is a leading indicator, then we can certainly expect other hard commodities to fall back during the first-quarter too!
Precious Metals Outlook
The outlook for Gold leads our analysis for 2020. Much has been written about its price direction since 2016 when gold rose by +30% per cent, from $1046.45 to $1375.27. When prices broke above $1375.27 in June (2019) last year, every analyst under the sun turned super-bullish. That’s not entirely unexpected – large institutional investors have been sidelined for several years, since gold peaked at $1921.50 back in 2011 – but now, they’re back in force. Only last week (Jan. 10th), the latest COT net speculative long-positioning was at its highest for over 10-years at 322,200 contracts. That’s a warning that a corrective downswing is due to commence.
The Gold Question
But the more important question is ‘what is the dominant trend for gold and the other precious metals?’.
This year’s going to be make or break for precious metals. Whilst the gold mining stocks look set to explode higher later this year (just not now), bullion gold, silver and platinum may struggle to keep pace. The problem is this: 2011’s declines in both gold and silver can be counted as ending five wave impulse downtrends into the late 2015 lows. If so, it will be impossible for them to break to new record highs during the latter stages of the decennial ‘inflation-pop’ cycle. So everything rests upon whether those 2011-2015 declines are impulsive or corrective.
If gold miners are set for record highs, shouldn’t bullion follow? That seems logical and remains as our preferential bullish counts to this day. But that doesn’t mean we’re complacent either – we’re continuing to track gold’s three price-swing advance from 2015’s low whilst comparting this to silver’s relative underperformance. So far, the pendulum between medium-term bullish versus bearish forecasts has swung a little more to the bearish side basis recent developments. Gold reacted from just below zig zag measurements of 2015’s advance at last week’s high of 1611.37 – meanwhile, silver was still trading far below 2016’s initial high of 21.14 and more importantly, remaining below last September’s high of 19.666.
Together, these aspects suggest significant downside risk over the coming months. Declines may not yet reveal the true path over the medium-term, but they will clarify its intention should prices decline as deep as we expect them to – the secret is to remain open to these varying possibilities – both bullish and bearish Elliott Wave patterns are shown/discussed in this PART II series report/video.
New Commodities 2020 Video – PART II/III
We’ve amassed over 90 commodity charts from our EW-Forecast database in this year’s Commodities 2020 video – A NEW RECORD! Each one provides a telling story into the way Elliott Wave price trends are developing in this next ‘INFLATION-POP’ phase of cycle development. We’re taking a look at some very specific patterns that span the entire SUPER-CYCLE, explaining why the super-cycle began from the GREAT DEPRESSION lows of 1932 and not from the lows of 1999 and how this ended in 2006-2008 and why the multi-decennial corrective downswing that began soon afterwards is taking the form of a very specific, but identifiable Elliott Wave pattern.
We invite you to take this next step in our financial journey with us – video subscription details are below – just follow the links and we’ll see you soon!
Most sincerely,
Peter Goodburn
Founder and Chief Elliott Wave Analyst
WaveTrack International
Commodities Video Part II Contents: 92 charts
• CRB-Cash index + Cycles
• Copper + Cycles
• Aluminium
• Lead + Cycles
• Zinc + Cycles
• Nickel
• Tin
• XME Metals & Mining Index
• BHP-Billiton
• Freeport McMoran
• Antofagasta
• Anglo American
• Kazakhmys Copper
• Glencore
• Rio Tinto
• Teck Resources
• Gold + Cycles
• GDX Gold Miners Index
• Newmont Mining
• Barrick Gold
• Agnico Eagle Mines
• AngloGold Ashanti
• Silver + Cycles
• XAU Gold/Silver Index
• Platinum
• Palladium
• Crude Oil + Cycles
• Brent Oil
• XLE Energy SPDR Index
CONTACT US NOW VIA EMAIL – SELECT YOUR PACKAGE
Single Video – *$48.00 – PART II COMMODITIES Video Outlook 2020 (January 2020)
Triple Package offer – *$96.00 (saving 33%)! – PART I – PART II – PART III (January – March ’20)
*(additional VAT may be added depending on your country – currently US, Canada, Asia have no added VAT but most European countries do)
PART III will be available in a few weeks’ time – we’re working on it!
HOW CAN YOU RECEIVE THE VIDEO FORECAST?
To receive your VIDEO UPDATE please click here to contact us.
– Please state if you wish to purchase the SINGLE VIDEO – Commodities Video Outlook 2020 for USD *48.00 and send us an email to services@wavetrack.com?
– Or opt for the TRIPLE PACKAGE for USD *96.00 in total?
– Next we will send you a PayPal payment request and provide you with the video link & PDF report once payment is confirmed. Please know the reply can take up to 6 hours due to time zone differences. But rest assured we will give our best to provide you with the information as soon as possible!
*(additional VAT may be added depending on your country of residence. Currently, the US, Canada, Asia have no added VAT but most European countries do)
We’re sure you’ll reap the benefits – don’t forget to contact us with any Elliott Wave questions – Peter is always keen to hear your views, queries, and comments.
Visit us @ www.wavetrack.com
Comments
Leave a Reply

