Deutsche Bank – Elliott Wave Buy Signal!
by WaveTrack International| April 26, 2018 | 2 Comments
Deutsche Bank Profit Down -79%! Elliott Wave Buy Signal!
Deutsche Bank AG announced its first-quarter earnings today (Thursday). Profits are down by a massive -79% per cent and trading revenue down by -17% per cent. The bank said it was scaling-back certain trading and lending activities in the U.S. and Asia whilst it undergoes a complete reorganisation of priorities. This includes focusing on business lending to its corporate clients in Europe.
We already know about DB’s restructuring following the departure of its former Chief Executive John Cryan and the appointment of Christian Sewing. Over recent months, analysts have marked-down Deutsche Bank’s growth potential. And now, S&P Global Ratings recently announced that DB’s ‘A’ rating is on review for a downgrade. But are these latest quarterly earnings a guide to the future performance of the share price?
Elliott Wave Analysis – Setting the Scene
It’s easy to get carried away with the bearish sentiment for Deutsche Bank. However, from an Elliott Wave perspective, the outlook for its share price is bullish.
On the 10th October 2016, our equity update of Deutsche Bank issued the last buy signal at 12.035. This followed the completion of a major low at 8.837 the week before (9.898 pre-share-split of March ’17) for primary wave B. The culmination of declines that originated from the April ’10 peak of 60.55. Primary wave C upside targets were also published in that report targeting 42.23+/-, max. 73.94+/- over the next several years.
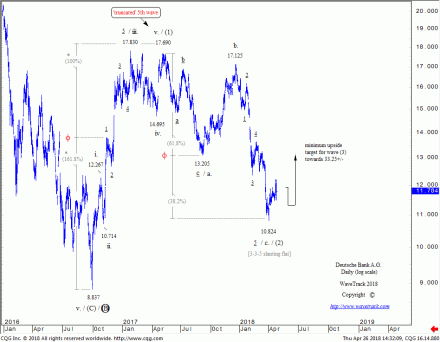
Primary wave C must ultimately develop higher into a five wave impulse sequence. Naturally, labelled in intermediate degree, (1)-(2)-(3)-(4)-(5). Wave (1) has since developed higher from that September ’16 low of 8.837 (9.898). This pattern subdivided into a smaller five wave impulse sequence which affirms its medium-term uptrend. This initial stage of the uptrend ended in May ’17 at 17.690 as wave (1) with following counter-trend declines as wave (2).
Shorter-term
The five wave impulse uptrend as wave (1) can be seen ending at 17.690 – see fig #1. Note that by extending the initial 1-2-1 sequence by a fib. 61.8% ratio projects into the final high.
The subsequent decline as wave (2) has unfolded into a rather uncommon pattern, something R.N. Elliott himself described as a ‘slanting flat’. It is labelled in minor degree, a-b-c and subdivides 3-3-5 like any of the ‘flat’ variations, except this one ends measurably below the initial decline of wave a. For example, extending wave a. by a fib. 61.8% ratio pinpoints the low for wave c. into the early-April ’18 low traded last week at 10.824. So this means the entire counter-trend decline has completed wave (2) at this low.
Conclusion
Despite the bearish sentiment of Deutsche Bank, this Elliott Wave analysis indicates a very bullish outlook and an opportunity to add to long positioning. This is, of course, a ‘contrarian’ signal but this fits the current sentiment extremes which occur at important turning points like this. Remember what it felt like back in October ’16?
If you haven’t already subscribed to our bi-weekly Elliott Wave Compass report and are actively watching or trading the markets, then do join our growing community – we have the answers you seek!
To subscribe, click here:
Institutions –
Private Investors –
Comments
2 Responses to “Deutsche Bank – Elliott Wave Buy Signal!”
Leave a Reply


May 31st, 2018 @ 5:57 pm
Hi there,
New low for DB! -6.5% today! It does not look (yet) like a 3rd bullish wave! Any update?
May 31st, 2018 @ 7:29 pm
Dear Blackpet, Thanks for pointing that out. We did not have time to create an update alert. But it is important to provide insight to our latest forecast. When DB broke below the 10.824 lowtraded April 4th, the picture turned bearish – it’s still tradingabove the Sep.’16 low of 8.837 but it does appear it will breakit…inexplicable why current decline broke below 10.824 if the Sep’16 upswinginto the Jan.’17 peak at 17.830 unfolded into a five wave pattern – no obvious solution from the weekly pattern counting down from April ’10 high unless thisis unfolding into rare five wave impulse but with zig zag subdivisions in eachimpulse sequence…assuming it is, next downside target would be towards 7.016+/- measuring the two declining sequences from 2007 all-time-high and from April ’10 high at 100% equality (log scale). We hope this is of help. Very best wishes, WaveTrack