The hidden harmonic symmetry into the Elliott Wave pattern!
by m.tamosauskas| December 7, 2015 | 9 Comments
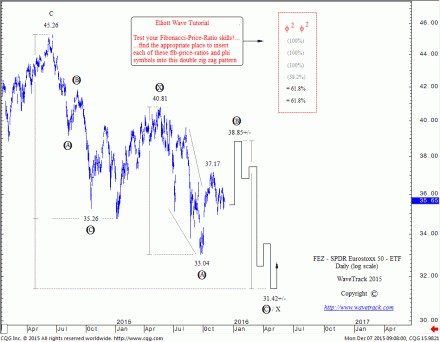
As we continue to update the myriad of different contracts within our ever-expanding portfolio in preparation for the release of annual 2016 forecasts, one new ETF has caught our attention. It is the ETF for the Eurostoxx 50 index and trades under the symbol FEZ. It has grossly underperformed the underlying index as all ETF’s do within a persistent declining phase because of the latent roll-overs etc. But somehow, this one has retained its near-perfect Elliott Wave structure and geometric Fib-Price-Ratio dimensions.
We would like to encourage you to train your eye spotting these powerful Fib-Price-Ratio and in this post we will leave annotations separate from the chart. Take a time and find most common Fibonacci ratios within a double zig zag pattern. We will update this chart during the next few days!
Tags: FEZ
Comments
9 Responses to “The hidden harmonic symmetry into the Elliott Wave pattern!”
Leave a Reply


December 7th, 2015 @ 11:25 pm
I see the pattern you’ve produced, yes, it’s very sensible with an implied a=c, and a 62% retrace of the bigger pattern. It fits the channel as well, as well as my nodes. I used the date 1/20/2016, interpreted from your graph, and the value 38.85…looks good..
December 7th, 2015 @ 11:27 pm
And the other graph, same parameters, lines up with the 1.0 node, where trend changes often happen. The fixed preset trendlines on this view are not respected, but that sometimes happens.
December 7th, 2015 @ 11:50 pm
Here, this is cool. The spreadsheet that plots this channel uses the starting point of 5/21/15, and the endpoint 8/24/15, that’s 68 trading days. the 1.00 node on 1/20/16 is projected 175 trading days out from 5/21/15. (175/68) = 2.574, not far from 2.618. Off of perfect by 1.7%.
December 8th, 2015 @ 3:49 pm
Notice that FEZ is having a bad morning, Probably know in the next couple of days if it has the mojo to recover and head higher. Right now it is at the ‘earlier’ 1.0 node (there are three of them) and struggling.
December 8th, 2015 @ 4:21 pm
Thanks Mark for your input! Basis Elliott Wave analysis a lower low within the decline that began from the late November highs was required to complete an expanding flat pattern. Lets see if markets can hold today’s support!
December 8th, 2015 @ 4:30 pm
As you saw from my earlier posts on this thread, your projections do fit well with my stuff. Nothing that has happened yet has negated those possibilities.
December 9th, 2015 @ 2:34 pm
I just went ‘smaller’ and decided to go into the fractal deeper, and see what would come out. I used this bit, and the analysis to follw displays that which is to the right of the red line.
December 9th, 2015 @ 2:36 pm
So, 1/21/16 is a good fit at this level, and 1/20/16 is a perfect fit, reaching a perfect 1.0 node on this smaller scale. That is a good sign…With an extenstion ratio of 3.227 approximately 2 x 1.618…
December 11th, 2015 @ 3:39 pm
Looks like support is down at calculated 34.125, after zigzag. All looks good, still making a higher bottom than the last one.. I cheated and put the projection in this chart..