Elliott Wave Pattern Precedes ECB Announcement
by WaveTrack International| December 4, 2015 | 8 Comments
Perfect Reaction Following ECB
Yesterday’s market reaction following the European Central Bank announcement was entirely predictable – no guessing required. Wednesday night’s update from the mid-week EW-Navigator supplement ahead of Thursday’s ECB meeting concluded…
‘…we expect the Eurostoxx 50 benchmark to decline by -5.4% per cent before resuming higher later. This probably suggests the ECB will either dilute its plan to extend its bond-buying programme or the market will be in some way disappointed with its tone’.
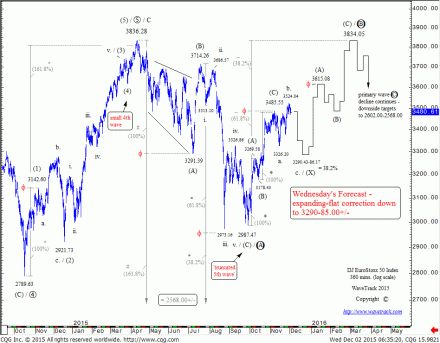
Contrary to consensus, this statement was made because a THREE WAVE ZIG ZAG pattern had just completed its advance from the mid-November low for the Eurostoxx 50 benchmark index. In this location, it is designated the SECOND sequence within a corrective EXPANDING FLAT decline, labelled intermediate wave (X). To complete the THIRD sequence, a decline of at least -5.4% was required. See original forecast from Wednesday’s report – fig #1. Downside targets are forecast to 3290.43-86.17+/-. These are derived where minor wave a. of the expanding flat is extended by a fib. 23.6% ratio and where the decline ends at the fib. 38.2% retracement level of the preceding advance.
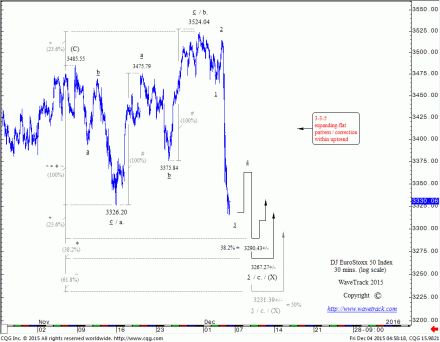
This next chart illustrates a close-up view of the expanding flat and what happened after the ECB announcement – see fig #2. The decline represents the THIRD sequence of the EXPANDING FLAT, labelled minor wave c. It must unfold into a five wave pattern – original downside targets remain valid, but we’ve added to additional Fibonacci levels using a fib. 38.2% extension ratio, and 61.8% to 3267.27+/- and 3231.39+/- respectively. The 3231.39+/- level is also the fib. 50% retracement level of the preceding advance from the September low.
In order to find the exact low point, the fourth wave within minor wave c.’s decline must unfold prior to taking additional measurements.
Looking at the implications of this EXPANDING FLAT, we know that such a pattern is a counter-trend sequence within a prevailing, dominant, directional UPTREND. So once completed, the uptrend is expected to resume.
Don’t forget – our bi-weekly Elliott Wave Compass report features many short-term updates of various asset classes.
Successful trading with WaveTrack International
Subscribe to the EW-Compass here…
Comments
8 Responses to “Elliott Wave Pattern Precedes ECB Announcement”
Leave a Reply


December 4th, 2015 @ 6:43 pm
I don’t have access to the STOXX 50 dataset on Yahoo, but there is an ETF called ‘FEZ’ which tracks it. Using the high value on 5/21/15, and the lows at 8/24/15 and 9/24/15, through the math, it’s possible to ‘unroll’ the price action. This produces this chart:
December 4th, 2015 @ 6:47 pm
Using instead, 5/21/15, 7/7/15 and 8/24/15, it produces another chart that very possibly has a channel in it, which I have added with the dashed line. All solid lines are predefined trend lines that are always real and preset, if sometimes unused by the markets, whereas the dashed ones are drawn in where they appear appropriate.
December 4th, 2015 @ 6:51 pm
Since this is basically time plotted as a type of logarithm, it ‘uncurls’ the market action. so the left edge of these two charts are 8/24 and 9/24, I hope the price action still looks recognizable compared to the chart you posted, it’s there, but looks different..
December 4th, 2015 @ 7:29 pm
A parameter associated with the 5/21/15. 7/7/15, and 8/24/15 chart is very weak, stepping back, an earlier chart run against 10/16/14, 11/26/14,and 5/21/15 produces this next chart, some chance the market couid fail at the magenta trendline. Time will tell…
December 7th, 2015 @ 5:05 pm
Hi Marc once again, thanks for your comments on FEZ – you propose an interesting aspect of
eliminating some of the roll-over gaps within the ETF…but somehow,
miraculously, even with these gaps, perfect Fibonacci-Price-Ratios are
formed…take a look at
our Elliott Wave Tutorial (new post) to find out where harmonic symmetry is
hidden into the pattern!
December 7th, 2015 @ 10:50 pm
For sure, these things I call ‘nodes’ are just fib price time ratios bundled differently. Internally, I have a parameter I call an EPTP index, Exponential Price Time Ratio, in which are embedded Fibonacci terms. Usually, at the confluence of nodes from adjacent or nested patterns, one will see the familiar fib, price or time ratios appear. The ratio for the last little bit (from 8/24 to 9/24) came out to be a value of .744, where as the normal value is around .62. This usually presages weakness, although a really bad reading is north of .8. It’s not instant death of trend at this level, but it may not have ‘legs’…but central banks are pumping, so it may have more legs than it should, enough to penetrate overhead resistance.
December 7th, 2015 @ 11:05 pm
I will look over your new material, I find all things Fibonacci to be intriguing.
December 5th, 2015 @ 3:29 pm
Hi Mark, thanks for sharing your thoughts!