NEW UPDATE! Nasdaq 100 Breaks to Higher-Highs – then Collapse!
by WaveTrack International| March 15, 2018 | 2 Comments
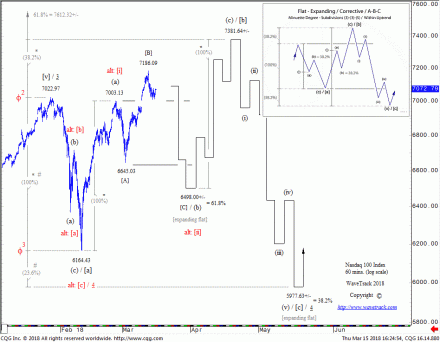
NASDAQ 100 – EXPANDING FLAT! – NEW UPDATE!
Some of the major U.S. indices that declined during January/February’s sell-off unfolded into five wave impulse patterns. Yet, others developed into three wave corrective sequences. In order to maintain positive-correlation and pattern alignment, the ‘default’ procedure is to adopt developing [a]-[b]-[c] 5-3-5 zig zag pattern for the former. And naturally, an [a]-[b]-[c] 3-3-5 expanding flat patterns for the latter.
There is only problem with this. It demands a -19% decline for the outperforming Nasdaq 100 during wave [c]’s final sequence! That’s far too big compared to European and Asian indices. As these are already in the final stages of ending counter-trend declines that began from the November/January highs.
There are only two ways to reconcile this amplitude dislocation. Either the Nasdaq 100 and other U.S. indices will underperform European indices during wave [c]’s declines? Or the February lows ended the entirety of January’s correction for all U.S. indices with new impulse uptrends already in upside progress! However, with only a minor correction unfolding during the next week or so, correlating to final declines in Europe/Asia.
Shorter-term, we’ve detected the more recent upswing for the Nasdaq 100 from the early-March low of 6645.03 into this week’s high of 7186.09 unfolding into a three wave zig zag – see fig #1. That indicates wave (b) is transforming from a zig zag correction. Originally labelled ending at 6645.03, into a more complex correction, an expanding flat. However, wave [C] downside targets are now towards 6498.00+/-.
Conclusion
We can’t be certain which of these two scenarios will unfold! But one thing is for certain, a short-term decline to 6498.00+/- would present the next major buying opportunity. This is labelled as either ending wave (b) within a zig zag with wave (c) upside targets to 7381.64+/- or ending minuette wave [ii] two within a new impulse uptrend.
Are you trading Nasdaq 100, Russell 2000, Dow Jones 30, EuroStoxx, Dax, FTSE100, Shanghai Composite, Hang Seng or ASX200? Don’t miss WaveTrack’s regular updates in our bi-weekly EW-Compass Report! Ensure you’re tracking our Forex forecasts – subscribe online for the EW-COMPASS REPORT.
Visit us @ www.wavetrack.com and subsribe to our latest EW-COMPASS report!
Comments
2 Responses to “NEW UPDATE! Nasdaq 100 Breaks to Higher-Highs – then Collapse!”
Leave a Reply


March 16th, 2018 @ 9:11 am
This expanded flat in expanded flat is even more ridiculous. Wave 2 was already expanded flat so forget it – alternation, plus it will be unproportionally huge break the trend lines and move below MA200, wave 4 do not do that.
Either we have wave ii of 5 or the TOP is in.
There is no rule when NDX makes a high SPX should follow. Why not non-confirmation the rally is over? Top 2000?
I am watching the European markets they are done with the rally from Feb.2016 Eurostoxx 50 spending more than a month below MA200 again wave 4 do not do that.
It is more likely the top is in, we have the first leg lower and now multi month correction for 2 or B like in 2000/2015 to test the top.
March 16th, 2018 @ 9:55 am
This would need a much more in-depth discussion. This exceeds this forum as it needs as well respect and understanding where everybody is coming from. However, most of all we wish you great success with your investment and have a wonderful time.