SP500 – Higher-Highs but Approaching a Terminal Peak
by WaveTrack International| August 7, 2018 | 4 Comments
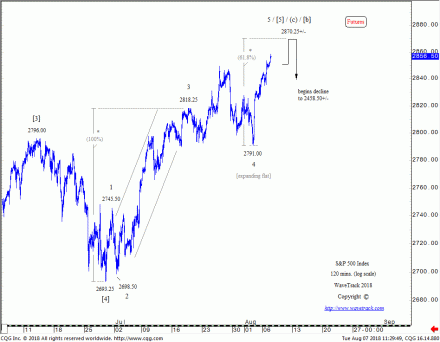
Despite the SP500’s intra-hourly five wave impulse decline from the July 25th high of 2849.50, the index has manged to secure a higher-high this week. Something that shouldn’t have occurred if a new downtrend was about to begin. There’s only one explanation. The five wave pattern was the concluding sequence within an expanding flat correction. In this case, a-b-c where its three price-swings subdivide 3-3-5 with the five sequence ending at 2791.00 – see fig #1.
The expanding flat is then incorporated into the developing five wave upswing that began from the late-June low of 2693.25 as micro wave [5]. Subdividing 1-2-3-4-5, the expanding flat becomes wave 4 with wave 5 already in upside progress. The fib-price-ratio measurements project to 2870.25+/- where wave [5] unfolds by a fib. 61.8% ratio of waves 1-3. If the same ratio measurement is used but including the ‘b’ high within wave 4, then wave 5 could push as high as 2890.00+/- but this is seen as a lower probability event.
It’s worth noting that the recent five wave decline in the Nasdaq 100 (not shown) from 7530.00 to 7166.75 was too large to be incorporated as wave 4 within the same five wave upswing from the late-June low as the SP500. Which means there is a heightened probability it will crash lower from below the existing 7530.00 high.
Conclusion
April’s diagonal pattern remains the best description for this uptrend from 2553.80. Comparing this with other indices like the Nasdaq 100 simply reinforces the bearish implications. Even the Dow Jones Industrial Average which is simply attempting a retest of its late-February high is alerting to bearish divergence across the major U.S. indices. We anticipate a -12% per cent decline unfolding over the next few months.
Are you trading the SP500, EuroStoxx, Nasdaq 100, Russell 2000, Dow Jones 30, Dax, FTSE100 or ASX200? Don’t miss WaveTrack’s regular updates in our bi-weekly EW-Compass Report! Ensure you’re tracking our Forex forecasts – subscribe online for the EW-COMPASS REPORT.
Visit us @ www.wavetrack.com and subsribe to our latest EW-COMPASS report!
Comments
4 Responses to “SP500 – Higher-Highs but Approaching a Terminal Peak”
Leave a Reply


August 9th, 2018 @ 3:29 pm
Isn’t it possible that a wave 4 triangle ended at 2677 cash and is now progressing in wave 3 from the 2693 low? Wave a of the triangle was a .386 retracement of the prior wave 3 advance. It would now require a move back under 2791 to invalidate this count.
August 9th, 2018 @ 5:06 pm
Dear Jay Sanderson, Excellent question! Labelling a triangle like this might be problematic because it fails to connect the boundary lines correctly. Connecting waves B-D are okay, however, it chops off the origin of wave A. Furthermore, connecting waves A-C are also okay, but the boundary line doesn’t include wave E. Professional elliott wave analysts are not known for being too particular over how a triangle looks. Yet, we believe that ratio and proportion are an integral part of pattern determination. It’s a very good idea to explore in this case for the SP500, but if you attempt to connect the boundary lines, it’s problematic. Another observation is to attempt the same triangle with the Dow (DJIA)..and again, we believe it doesn’t work unless the later low in late-June is used to end wave E. One good option is to test a wave count, to attempt to pull positive correlation together across all indices. That doesn’t necessarily mean pattern alignment as amplitudes and differing performances can create different patterns, but that must not change the correlation – so far at least, there’s not been enough oomph in April’s impulse advance to confirm this as a 3rd wave…rather wave C within a zig zag, and that’s so far, uniform across most of the major indices. Very best wishes!
August 9th, 2018 @ 7:38 pm
Thank you for your reply. I just wouldn’t think the US markets would see a double digit decline going into the mid terms. But anything is possible in our unstable world.
August 11th, 2018 @ 4:26 pm
…mid-term elections, yes, quite
understand where you’re coming from!…let’s see!