Russia RTS Index – Decline Underway?
by WaveTrack International| October 3, 2019 | 2 Comments
Russia RTS Index – Decline Underway Towards 1171.00+/- but Downside Risk to 990.00+/-
Two Elliott Wave pattern developments dominate the short-term picture over the next few months – both confer a decline to minimum levels of 1171.00+/- but there is also a heightened downside risk of a sustained decline towards 990.00+/- as the concluding sequence of an a-b-c running flat pattern that began from the Jan.’17 high. The medium-term outlook remains very bullish with outperformance forecast during the next few years.
The Russia RTS is a favourite of ours, mainly because it fits the pattern schematic of the A-B-C ‘Inflation-Pop’ from its financial-crisis low of 493.00 but also because its upside potential as primary wave C is huge during the next several years.
Wave C’s uptrend must ultimately develop into a five wave impulse pattern, labelled (1)-(2)-(3)-(4)-(5). A 2nd wave correction as a subdivision within intermediate wave (3) began from the Jan.’17 high of 1197.00. It was originally identified as completing an a-b-c running flat pattern into the Dec.’18 low of 1033.00, the same time that U.S. indices, including the S&P 500 ended their corresponding expanding flat patterns.
But the following advance into the July ’19 high of 1414.00 is problematic. It’s difficult to identify this upswing as unfolding into a five wave impulse pattern. However, this irregularity in identification opens the way for two developing scenarios. Although, both confer a more immediate short-term decline testing levels towards 1171.00+/-.
Russia RTS Index – Count #1
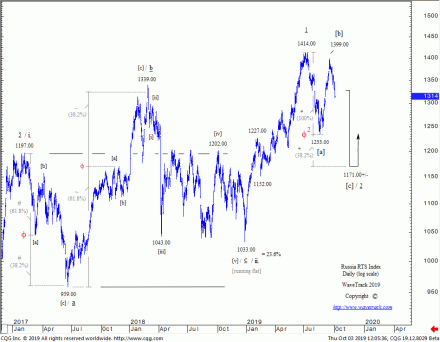
Count #1 – the Dec.’18 advance from 1033.00 to July’s high of 1414.00 unfolded into a five wave sequence. A counter-trend corrective downswing is currently engaged, targeting levels towards 1171.00+/-. See fig #1.
Russia RTS Index – Count #2
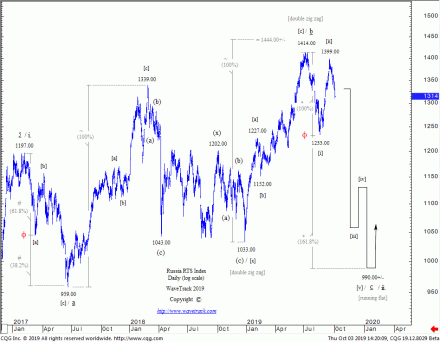
Count #2 – this scenario depicts the continuation of the a-b-c running flat pattern that began the corrective downswing from the Jan.’17 high of 1197.00. Wave b has unfolded higher into a multi-year double zig zag pattern ending last July at 1414.00 – wave c must now develop lower into a five wave impulse pattern with an ultimate task or revisiting the 2017 low of 959.00+/-. Fib-price-ratio targets are towards 990.00+/-. See fig #2.
Conclusion
The Russia RTS’s pattern development from its June ’17 low in incredibly complex. Hence, two ongoing scenarios. But when juxtaposed to each other, both confer a minimum downside risk towards 1171.00+/-. Most importantly, this is in alignment with expectations of deeper corrective declines emerging from U.S./European indices. A time horizon is into the Jan/Feb.’20 period.
Comments
2 Responses to “Russia RTS Index – Decline Underway?”
Leave a Reply


October 26th, 2019 @ 1:38 am
Any revised counts on this one, Peter, now that it’s presenting the possibility of breaking out…..?https://www.tradingview.com/x/i1v7fSgv/
October 29th, 2019 @ 10:11 am
Hello TAJ, A break above July’s high of 1414.00 is a surprise ‘cos it very much looked like the downswing into August at 1233.00 was a five wave pattern. European indices ended expanding flat patterns in August and have made higher-highs since, so positive correlation – It might be possible the August upswing is a zig zag – if so, resistance would be around 1460.00-90.00+/-. So much for what we observe on the quick for you. Very best wishes and have a great day! WaveTrack International