Nasdaq 100 Heading for Major Support
by WaveTrack International| November 21, 2018 | 3 Comments
Nasdaq 100 Breaks October Low but Heading for Major Support
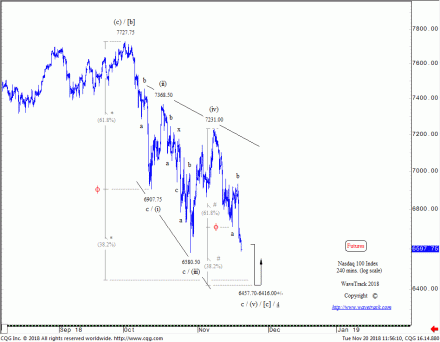
The Nasdaq 100 has traded deeply inside the early-November recovery advance. However, now the Nasdaq looks set to even break below the late-October low of 6580.50 (futures) – [see fig #1]. But rather than signalling an extended decline, this transforms the early-October decline from 7727.75 into an ending/expanding-diagonal pattern. According to the Elliott Wave principle labelled (i)-(ii)-(iii)-(iv)-(v). Particularly, wave (v) is now in decline but approaching measured downside targets towards 6457.70-6416.00+/-.
Note that each impulse wave of the diagonal, (i)-(iii)-(v) subdivides into a required zig zag or double zig zag pattern, i.e. a-b-c. This provides specific pattern-recognition for the diagonal and its probable completion.
Conclusion
The large-cap indices like the S&P 500 are unlikely to break below the equivalent late-October lows. So this extended trade lower for the Nasdaq 100 represents relative underperformance reflecting the current pessimistic sentiment for FAANG stocks and the like. Allowing for a contrarian opportunity to buy/remain long.
The larger picture adds this diagonal pattern into this year’s two preceding sequences. Consequently, showing the Nasdaq 100 completing an [a]-[b]-[c], 3-3-5 running flat pattern as minute wave 4. That in itself is very bullish for the next several months into H1-2019.
Furthermore, the latest update on the Nasdaq 100 can be found in WaveTrack bi-weekly EW-Compass report on the STLG/USD, EUR/USD, US Dollar Index, Bitcoin, SP500, US Dollar Index, Crude Oil, EuroStoxx, Russell 2000, Dow Jones 30, Dax, ASX200 and more! Don’t miss WaveTrack’s regular updates in our bi-weekly EW-Compass Report! Ensure you’re tracking our Forex forecasts – subscribe online for the EW-COMPASS REPORT.
Visit us @ www.wavetrack.com and subsribe to our latest EW-COMPASS report!
Comments
3 Responses to “Nasdaq 100 Heading for Major Support”
Leave a Reply


November 21st, 2018 @ 4:13 pm
Was the low yesterday at 6450 the final low or do you expect one more move down next week?
November 21st, 2018 @ 6:11 pm
Thanks for your message. Our EW-team is currently working on the analysis and will publish it in tonight’s EW-Compass report. Very best wishes.
November 22nd, 2018 @ 7:14 am
What, it is not a triangle??? I am shocked again:)
The low is next week after that rally for several months.
P.S. there is no expanded flat, there is no triangle, there is no running flat. The major low is next year with 4 year cycle low.