NASDAQ 100 – EXPANDING FLAT!
by WaveTrack International| March 13, 2018 | 4 Comments
Nasdaq 100 Breaks to Higher-Highs – then Collapse!
During January’s steep declines, benchmark indices like the S&P 500 unfolded lower whilst developing into five wave impulse sequences. If so, then this indicates downward continuity once a three wave corrective upswing has ended. But some indices like the outperforming Nasdaq 100 declined from January’s high into the mid-February lows unfolding into a three wave zig zag pattern. So how can you have two major indices that are positively-correlated unfolding into two diametrically opposite patterns? One that implies downward action, the other upward!
The Un-Common Denominator – Elliott Wave Pattern Secret
Well, there is a un-common denominator! And it combines a zig zag development for indices like the S&P 500 and the broader Value Line Index with yes, an expanding flat for the Nasdaq 100.
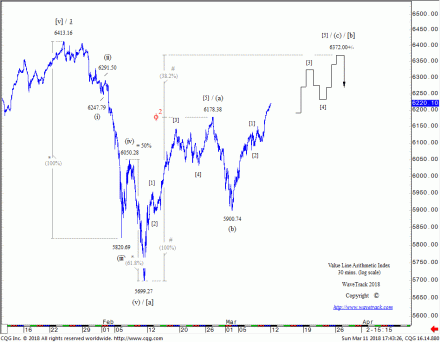
The Value Line index was selected as a ‘proxy’ for the slight underperforming indices because it declined from the January highs into a picture-perfect five wave impulse pattern, from 6413.16 to 5699.27 – see fig #1. Using proprietary fib-price-ratios, note that wave (v) five declined by a fib. 61.8% ratio of waves (i)-(iii) ending at the exact low. That gave unequivocal confirmation that the decline did unfold into a five wave pattern, not a three, and that a counter-trend rally would then unfold. But that counter-trend rally must end below the January high. It can be very deep, but basis the rules of the Elliott Wave Principle, it must end below 6413.16. If the Value Line index is scheduled to complete a counter-trend rally ending below the January high before resuming the larger zig zag decline afterwards, then in all probability, the outperforming Nasdaq 100’s advance to higher-highs will also be capped, and that’s where the expanding flat comes in.
Value Line and the Nasdaq 100 and Zig Zag Patterns
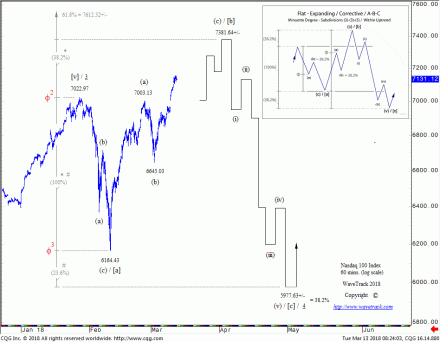
Both the Value Line and the Nasdaq 100 are pushing higher from the mid-February lows into three wave zig zags but whereas the Value Line should not, must not break to higher-highs, this is a perquisite for the Nasdaq 100 because its January decline unfolded into a three wave zig zag, not a five wave impulse sequence – see fig #2.
The Nasdaq 100’s expanding flat is labelled in minuette degree, [a]-[b]-[c] – see tutorial chart, inset. Wave [a] declined to 6164.43 as a zig zag and this is being replicated by wave [b]’s subsequent advance. Note that wave (a) of this zig zag ended below the preceding January peak that began the pattern. Extending wave [a] by a fib. 38.2% ratio projects a terminal high for wave [b] towards 7381.64+/-. It looks like it will be a tight squeeze to fit a five wave subdivision into wave (c)’s advance from 6645.03 but it’s certainly possible. The rarer fib. 61.8% extension ratio comes in at 7612.32+/- but this seems unlikely to be tested relative to upside targets for other major indices, including the Value Line.
Conclusion
Once wave [b] ends the Nasdaq 100’s advance, it opens the door to another sizable sell-off for wave [c] within this developing expanding flat pattern. Downside targets are towards the 5977.63+/- area, derived by extending wave [a] by a fib. 23.6% ratio. This was selected over-and-above the other two fib-price-ratios because this closely converges with the fib. 38.2% retracement support of the preceding uptrend.
Market commentators are split between the hedonistic-bullish, and the perma-bears, but on this occasion, it looks like those treading the middle-ground have a more realistic chance of trading successfully in the months ahead.
Are you trading Nasdaq 100, Russell 2000, Dow Jones 30, EuroStoxx, Dax, FTSE100, Shanghai Composite, Hang Seng or ASX200? Don’t miss WaveTrack’s regular updates in our bi-weekly EW-Compass Report! Ensure you’re tracking our Forex forecasts – subscribe online for the EW-COMPASS REPORT.
Visit us @ www.wavetrack.com and subsribe to our latest EW-COMPASS report!
Comments
4 Responses to “NASDAQ 100 – EXPANDING FLAT!”
Leave a Reply


March 13th, 2018 @ 1:44 pm
Gutsy call in this present market…..looking forward to seeing the outcome.
March 15th, 2018 @ 4:18 pm
Thank you for your comment! Let’s see what the market decides!
March 15th, 2018 @ 12:58 pm
Another expanded flat which will not play out. Think how fear works.
You are telling that we will see two panic sell off in the same pattern within a few weeks. Fear does not work this way, look at history either A or C is panic sell off not both.
On this scale 10%+ correction within few weeks is very unlikely such pattern to play out.
Expect higher low for the indexes including NDX.
P.S. Hint – w1 of ED
March 15th, 2018 @ 4:18 pm
…thanks for your comment – yes, when viewed in isolation, possibility that Nasdaq 100 began new uptrend already – five wave impulse upswing to
7003.13 is 1st wave…expanding flat unfolding now as 2nd wave to 6498.00+/-…but big problem is reconciling other indices that declined
Jan/Feb into 5 wave impulse…this conveys downside continuity, i.e. 5-3-5 zig zag…unsure of your hint…no evidence of 3 wave structure in
advance from Feb low to support w1 of ED – have you analysed Eurostoxx 50 and Xetra Dax?…there are certainly clues in those! Have a great day!