Gilead Sciences – Stock Pops +16% Overnight!
by WaveTrack International| April 17, 2020 | 2 Comments
Gilead Science’s stock pops +16% per cent in the pre-market following its announcement that its coronavirus drug trial shows encouraging early results. However, in the past it has been shown that vaccines need longer testing to be deemed safe.
Gilead Sciences has been on our stock-watch list since the beginning of the coronavirus pandemic began to spread outside of China in early February. Overnight news that it’s made progress in clinical testing of a new drug that combats the symptoms of the coronavirus has sent its stock price up +16% per cent in the pre-market.
Trading overnight has been as high as 89.38. Although it’s drifted lower in the last hour from that high to 84.20. But could this leap higher have been predicted? Any number of companies engaged in the rush to find a cure for coronavirus could be watched. However, this stock did get our interest early on because of its pattern development.
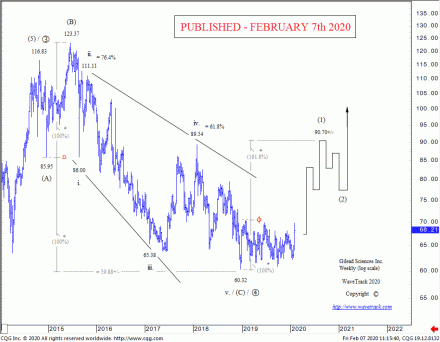
Back in December ‘18, Gilead Sciences had completed a multi-year corrective downswing that began from the Oct.’14 high of 116.83 at 60.32 – see fig #1. This correction unfolded into a typical Elliott Wave expanding flat pattern as primary wave 4 whilst labelled in intermediate degree, (A)-(B)-(C).
Gilead and Fibonacci Ratio Analysis
Wave (A) ended an initial three wave zig zag downswing to 85.95 which was followed by another zig zag upswing to 123.37. Wave (C)’s decline would normally extend below wave (A) by a fib. 38.2% ratio (or sometimes 23.6%. 14.58%). But in this case, it extended by a fib. 100% ratio. This rather uncommon fib-price-ratio measurement was required in order to fully balance the preceding uptrend of primary wave 3’s advance so that wave 4’s percentage correction was at least similar to wave 2’s decline.
Nevertheless, extending wave (A) by a fib. 100% ratio projected a terminal low for wave (C) to 59.88+/-. The actual low was in close proximity, at 60.32.
It then spent another year doing absolutely nothing until prices shot higher towards the end of February this year and now overnight to 89.38. As you can see from the chart, upside targets to complete wave (1) were towards 90.70+/-. And in answer to the original question, could this pop higher have been predicted, the answer is clearly yes.
What Next?
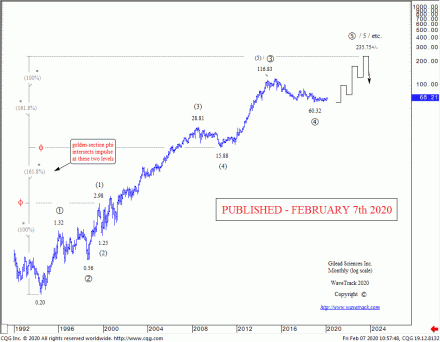
The long-term uptrend of Gilead Sciences shows an incomplete five wave impulse uptrend in development from the June ’94 low of 0.20 – see fig #2.
The December ’18 low ended primary wave 4 with a percentage decline of -48.3% per cent. Very similar to primary wave 2’s decline of -57.5% per cent.
Primary wave 5 now seems well established to the upside, notwithstanding a potential wave (2) correction at some stage soon. Other than that, primary wave 5 upside targets remain unchanged towards 235.75+/-. This measurement is derived by extending the initial 1-2-1 sequence from 0.20 to 2.98 by a fib. 161.8% ratio.
Subscribe!
Institutions –
Private Investors –
Comments
2 Responses to “Gilead Sciences – Stock Pops +16% Overnight!”
Leave a Reply


April 18th, 2020 @ 4:55 pm
It looks like XBI could be in a 3) of primary 3 higher. Do you follow this index?
April 20th, 2020 @ 10:46 am
We track the Nasdaq NBI Biotechnology index –
look out for our latest post on twitter. Hope this helps and have a great day.
https://uploads.disquscdn.com/images/15685cc80176ff877a7e424c1a9cd7b84d61a8c8b2d1f84e8aa6546b8c66c38f.gif