ELLIOTT WAVE Half Moon Pattern
by WaveTrack International| July 2, 2018 | 8 Comments
Half Moon Pattern – TWITTER question dated 30th June 2018:
Q. Great work! I have a question in which I hope you can answer. Elliot mentioned a phenomena in the market called the Half Moon. Was this a pattern and is this valid under the wave principle according to your opinion?
R.N. Elliott – The Wave Principle – page 30, paragraph 2, Half Moon
RARITIES IN THE 1937-1938 BEAR MARKET
The 1937-1938 Bear Market provided a number of Novelties, for example:
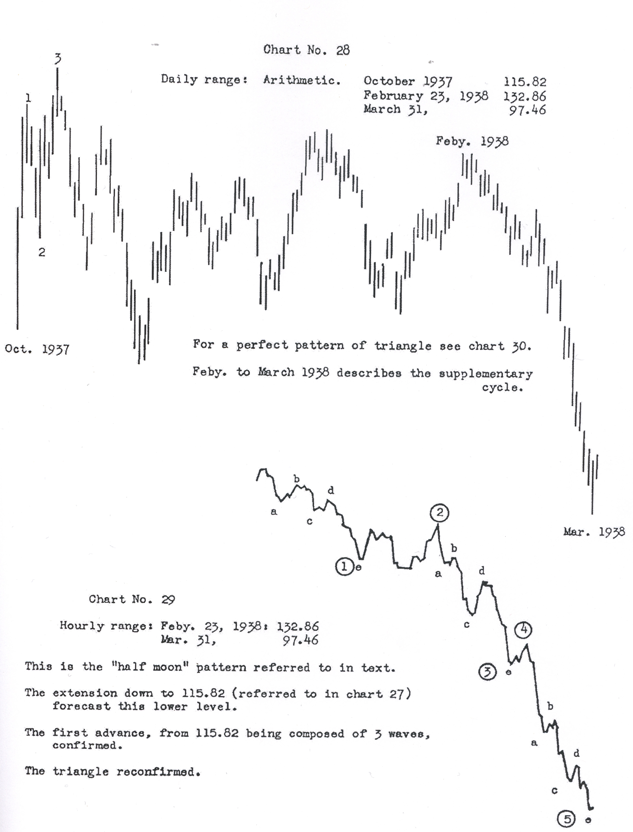
Half Moon Elliott Wave History: This is the name given to the pattern which developed between February 23rd and March 31st 1938, 132.00 to 98.00. It curved downward and at bottom almost perpendicular – just like a ‘half moon’. The same pattern occurred in April 1936, 163.00 to 141.00. Both were retracements of extensions. On account of the high speed, it is necessary to recur [sic, refer] to the hourly record, especially during the latter half. See Chart 29.
Peter Goodburn’s Half Moon Answer:
R.N. Elliott’s discoveries were a work in progress – given time, access to more historical data and the use of software that can measure Fib-Price-Ratios, I’m sure some of his notes would be amended in later revisions.
As for the – Half Moon – pattern (see ‘The Wave Principle’ – 1938) Elliott noted the especially the speed of the decline from the February 23rd 1938 high of 132.86 into the low of March 31st at 97.46. He indicated the velocity and trajectory of this decline was like a – half moon. Mainly, because the curvature of the acceleration into the low was almost perpendicular (inverse/vertical). He explained this was the case because the 5th wave within this impulse decline was the ‘extended’ wave sequence of the three impulse sequences. For example the largest of waves 1 3 5 – see fig #1 (charts #28 & #29 – The Wave Principle – R.N. Elliott – pages 30 & 47). See fig #1 in this article.
R.N. Elliott’s original Half Moon Pattern Example
He continued to make distinctions between the perpendicular decline of the February/March 1938 decline and the pattern during the Great Depression collapse of 1929-32. And yes, there are significant pattern differences in the way these two declines. But that is not the important issue.
Half Moon – The bigger question is whether 5th wave extensions always advance or decline in vertical/perpendicular characteristics?
We tend to think not because the 1974 advance is a cycle degree 5th wave extension and yet it shows no sign of an exponential or perpendicular rise (at least not so far!). This must be viewed with a perspective from the 1932 low. But we do acknowledge that this phenomenon is more likely to be seen in the wave ‘C’ location of a zig zag downswing when labelled as a 2nd wave. We’ve documented many situations when the ‘C’ wave slides lower in such a manner that it no longer measures in proportionality with the ‘A’ wave that preceded it. In this case it is much larger by comparison whilst its five wave subdivision often contains an ‘invisible’ 4th wave and sometimes a 5th wave ‘extension’.
WaveTrack’s Half Moon Observations
Peter Goodburn’s Dow Jones Half Moon Pattern Example
Let’s take another look at R.N. Elliott’s example of the – Half Moon – impulse decline. Can you see that it was actually the larger 5th wave, i.e. intermediate wave (5) within an impulse decline that began from the April ’37 peak of 195.50 labelled primary wave A? See fig #2. Wave (5) declined following the completion of a contracting/symmetrical-triangle pattern that unfolded in wave (4). Elliott’s observations concluded that a break-out following a triangle is severe and accelerative. And this is exactly what happened for wave (5)! It seems to us that wave (5) needn’t have contained a fifth wave extension because its trajectory and speed of decline was dictated by the triangle that preceded it. The fact that it did contain a fifth wave extension in its subdivision was, however, a contributing factor of the perpendicular way it ended the decline which resulted in Elliott’s Half Moon terminology.
Comments
8 Responses to “ELLIOTT WAVE Half Moon Pattern”
Leave a Reply

Recent Posts
Recent Comments
Archives
- June 2025
- March 2025
- February 2025
- January 2025
- December 2024
- August 2024
- July 2024
- June 2024
- May 2024
- April 2024
- February 2024
- January 2024
- December 2023
- August 2023
- July 2023
- June 2023
- March 2023
- February 2023
- January 2023
- December 2022
- November 2022
- October 2022
- August 2022
- July 2022
- June 2022
- May 2022
- March 2022
- February 2022
- January 2022
- December 2021
- August 2021
- July 2021
- June 2021
- March 2021
- February 2021
- January 2021
- December 2020
- November 2020
- August 2020
- July 2020
- June 2020
- May 2020
- April 2020
- March 2020
- February 2020
- January 2020
- December 2019
- October 2019
- September 2019
- July 2019
- June 2019
- May 2019
- April 2019
- March 2019
- February 2019
- January 2019
- December 2018
- November 2018
- September 2018
- August 2018
- July 2018
- June 2018
- May 2018
- April 2018
- March 2018
- February 2018
- January 2018
- December 2017
- November 2017
- October 2017
- September 2017
- August 2017
- July 2017
- June 2017
- May 2017
- March 2017
- February 2017
- January 2017
- December 2016
- November 2016
- October 2016
- September 2016
- August 2016
- July 2016
- June 2016
- May 2016
- April 2016
- March 2016
- February 2016
- January 2016
- December 2015
- November 2015
- October 2015
- September 2015
- August 2015
- July 2015
- June 2015
- May 2015
- April 2015
- March 2015
- February 2015
- January 2015
- December 2014
- November 2014
- October 2014
- September 2014
- August 2014
- July 2014
- June 2014
- May 2014
- April 2014
- March 2014
- February 2014
- January 2014
- December 2013
- November 2013
- October 2013
- September 2013
- August 2013
- July 2013
- June 2013
- May 2013
- April 2013
- March 2013
- February 2013
- January 2013
- December 2012
- November 2012
- October 2012
- September 2012
- August 2012
Categories
- ADXY Index
- Agnico Eagle Mines
- Alcoa
- Amazon
- AngloGold Ashanti
- Antofagasta
- APPL
- Apple
- ASX 200
- AUD vs USD
- AUDNZD
- AUDUSD
- Australia ASX 200
- Baltic Dry Index
- Banking
- Base Metals
- Biotechnology
- Bitcoin
- Bovespa
- Broadcom
- Catalexit
- central banks
- Christmas
- Commodities
- Commodities Video Outlook 2020
- Conference
- Copper
- Coronavirus Sell-Off
- CRB
- Crude oil
- crude oil price chart
- CryptoCurrency
- Currencies
- Currencies + Interest Rates Video Outlook
- Cycles
- Dax 30
- deutsche bank
- Dewey Cycle
- DJ Transportation Average
- DJ Utilities
- Dow Jones 30
- Dow Theory
- ECB
- economy
- Elliott Wave
- Elliott Wave Charts
- Elliott Wave Patterns
- Elliott Wave Principle
- Emerging Markets
- Ending-Diagonal Elliott Wave Pattern
- Equity
- EUR vs CHF
- EUR/USD
- Euro / US$
- Eurostoxx 50
- EuroStoxx50
- EuroStoxxBanks
- EURUSD
- Expanding Flat Pattern
- FAAMG
- FANG+
- fib-price-ratio
- Fibonacci Trading
- Fibonacci-Price-Ratio
- Financial Forecasting
- Fixed Income
- forex
- Freeport McMoran
- FTSE 100
- Fund Management
- FX
- FXStreet
- GBP/AUD
- GBP/USD
- GDX
- GDXJ
- Germany 10 year Euro Bund future
- Gilead Sciences
- Glencore
- Global Economy
- Gold
- Gold Mining
- Golden Ratio
- goldman sachs
- Google Inc.
- Google/Alphabeth
- Greek debt crisis
- Hang Seng
- Harbinger
- Hungarian Forint
- IBEX 35 Index Spain
- Independent Research
- India-CNX Nifty 50
- Interest Rates
- Interview
- IRP Independent Research
- kbw bank index
- Lonmin
- McDonald's
- MID-YEAR VIDEO UPDATE!
- Mifid II
- Mines
- Mining
- MSCI China
- MSCI Emerging Markets
- Nasdaq 100
- Nasdaq Biotechnology Index
- Nasdaq Composite
- Nasdaq100
- Netflix
- Newmont Mining
- Nikkei 225
- NVIDIA
- NYSE Composite Index
- Palladium
- Platinum
- Precious Metals
- Ralph Nelson Elliott
- Reversal-Signature
- Russell 2000
- Russia RTS
- S&P 500
- Sector
- Secular-Bull
- Sentiment Survey
- Shanghai Composite Index
- Silver
- Slanting Flat Elliott Wave Pattern
- SP100
- SP400 Mid-Cap
- SP500
- SPX 500
- STLG/AUD
- Stlg/US$
- STLG/USD
- STLG/YEN
- STLG/ZAR
- Stock Index
- Stock Index Tracking
- Stock Index Video
- Stock Indices
- Stock Indices Video Outlook 2023
- Stock Indices Video Outlook 2025
- Sugar
- Summary
- Tesla
- Tesla Inc
- Toyota
- Track Record
- trading
- Trusts
- Tutorial
- Uncategorized
- UniCredit
- US
- US Dollar Index (DXY) (USDX)
- US$ Index
- US-Dollar Index
- US10yrYields
- USD
- USD/ARS
- USD/CNY
- USD/IDR
- USD/INR
- USD/MXN
- USD/SGD
- USD/THB
- USD/YEN
- USD/ZAR
- Vale
- Value Line Index
- video
- VIDEO OUTLOOK 2018
- VIDEO OUTLOOK 2020
- VIX
- W.D. Gann
- WaveTrack International
- XAU Gold/Silver Index
- Xetra Dax
- XOP
- Yields
- Zig Zag
- Zinc
- ‘INFLATION-POP’
- ‘SHOCK-POP-DROP’
July 11th, 2018 @ 9:19 pm
Traditional chartists would just call this the “falling knife” phenomenon.
July 11th, 2018 @ 9:49 pm
Thank you, for adding this information to our discussion. Very best wishes.
July 19th, 2018 @ 10:57 am
The thing with Elliott wave you can never be wrong because there is always an alternative count to explain away why they didn’t get it right in the first place. Oddly they expect people to pay good money for this.
July 19th, 2018 @ 4:04 pm
One longtime Wave analyst told me “by the time you figure out exactly where in the wave you really are, by then you have already been washed out to sea”. Good joke no? However I do use Wave analysis as my main tool for chart analysis. I find it that good. It takes experience, knowledge and skill just like most other things in life. Happy trading.
July 20th, 2018 @ 8:24 am
Thank you, BrainsB4Emotions. Brilliant comment + we totally agree. Very best wishes.
July 20th, 2018 @ 5:49 pm
Another Wave joke that comes to mind > two newbie wannabe Wave traders were chatting one day about how frustrating wave counting can be when one trader asked the other trader why it was that Elliot had waved in the first place. The second trader replied he must have been IMPULSIVE whilst his wife must have been CORRECTIVE. Another good wave joke no.
July 26th, 2018 @ 12:11 am
Recently scientific researchers have discovered that the very best indicator of addiction is impulsivity. So we now know why it is that impulse waves are larger in both time duration and wave amplitude than corrective waves, because trading “junkies” are addicted to them. They keep trading the impulse waves upward until they finally crest, and all their trading acts to prolong and extend the impulse waves both in terms of time duration and wave amplitude.
Well that is what I believe anyway. What are your ideas about this research?
July 27th, 2018 @ 9:29 am
Very amusing! Would you be so kind as to send us a link for this research – its contents will assist our reply to you – many thanks.