Dow Jones – Expanding Flats + Triangles
by WaveTrack International| August 24, 2018 | 3 Comments
Elliott Wave Patterns – Expanding Flats + Triangles
Expanding Flats
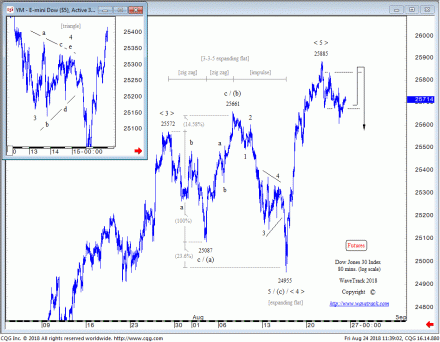
This year’s corrective downswing in the Dow Futures from January’s high is of particular interest. Mainly, because its early-April low at 23344.50 briefly penetrated below the early-February low 23360.20. This allows an expanding flat to develop from the February low as a corrective sequence. At the same time confirming April’s advance as the third sequence of the pattern rather than part of a sustainable uptrend. (See latest EW-Compass Report). April’s advance is labelled wave (c) unfolding into an ending/expanding-diagonal.
The final stage of April’s diagonal can be seen approaching a terminal high into current levels. A perfectly formed expanding flat formed from the late-July high of 25572 (futures) into the mid-August low of 24955 – see fig #1. Labelled (a)-(b)-(c) subdividing 3-3-5. Wave (a) declined into a zig zag. Wave (b) rallied into another zig zag prior to wave (c)’s decline as a five wave impulse into the 24955 low.
Moreover, fib-price-ratios (FPR’s) are evident. Providing authenticity to the pattern – extending wave (a) by a fib. 14.58% ratio projects within a few points of wave (b)’s high – extending wave (a) by a fib. 23.6% ratio projects wave (c) to within a few points of the actual low.
Triangles
Within wave (c)’s impulse decline, 1-2-3-4-5, wave 4 can be seen unfolding into a triangle (see inset, top-left). We bring attention to this because triangle patterns are actually uncommon patterns in terms of recurrence/frequency and are often misidentified in the EW community. This example is a good example of an actual triangle.
It’s important to ensure that each wave within the triangle, a-b-c-d-e develops within a near-symmetrical formation with approximately equal boundary lines. This ensures each wave gets close to touching the upper and lower boundary lines. If one sequence is too short so that it doesn’t approach the boundary line, then it probably isn’t a triangle at all which means the analyst must look at other possible wave counts. The only exception is in wave ‘e’ when sometimes, it does fall short. However, none of the others should exhibit this aspect.
Conclusion
The Dow has since traded to a higher-high at 25885. And whilst it could extend a little higher, this existing high has done enough to end the 5th wave thrust from the mid-August low whilst ending the larger 5th within April’s diagonal and the expanding flat from February’s low. That’s bearish!
Comments
3 Responses to “Dow Jones – Expanding Flats + Triangles”
Leave a Reply


August 24th, 2018 @ 11:13 pm
you have so highly reconsidered ( latest EM- COMPASS 25 aug) the purpose for NDX 100 ( from 7800+ to 8500+) after correction (imay be). What’s reason ?
August 26th, 2018 @ 5:54 pm
Thank you for your message. Original upside targets for minor wave v. five to 7835.00+/- were derived by extending minor wave iii. three from the Aug.’11 low into the July ’15 high by 61.8% but this is clearly not enough room for ending minor wave v. five – rather, taking a fib. 61.8% correlative ratio of minor waves i-iii. adding to iv. four’s low in Aug.’15 projects to 8525.00+/-…much better!
August 25th, 2018 @ 3:45 am
This expanded flat is not wave 4, the impulse finished in July. This is b wave.