Currencies + Interest Rates Mid-Year Video Update 2021
by WaveTrack International| August 10, 2021 | No Comments
Currencies + Interest Rates Mid-Year Video Update 2021 | PART III/III
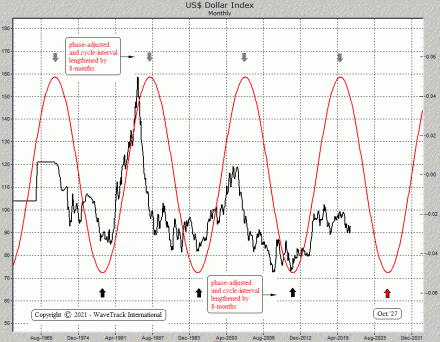
US$ Dollar’s Long-Term Trend Remains Downwards basis 15.6-Year Cycle – Shorter-Term Correction unfolding Higher Since January and Set to Continue until October/November – Euro/US$ Corrective Downswing to 1.1320+/- with all G10’s in Corresponding Corrections – Commodity Currencies set to Weaken during Next Several Months – Asian Currencies in US$ Dollar Corrections – Interest Rates Finishing Counter-Trend Downswings but Risks of Continuation – Inflation TIPS in Correction – Spreads indicate new Widening Phase has begun in Dollars and Euros – Italy’s Yields still Trending Lower – Japan’s JPY10yr Continuing Lower.
INCLUDES ANALYSIS ON MAJOR US$ DOLLAR PAIRS/CROSSES – ASIAN/EM CURRENCIES – MEDIUM-TERM CYCLES – LONG-DATED YIELDS US/EUROPE/JAPAN + SPREADS
We’re pleased to announce the publication of WaveTrack’s Mid-Year 2021 trilogy video series of medium-term ELLIOTT WAVE price-forecasts. Today’s release is PART III, CURRENCIES & INTEREST RATES – Parts I & II were released during the last month – see below for information.
• PART I – STOCK INDICES – out now!
• PART II – COMMODITIES – out now!
• PART III – CURRENCIES & INTEREST RATES – out now!
Review – H1 2021
Economies have reopened after lengthy lock downs last year. Starting with an initial growth rebounding by double-digits as pent-up demand flows through order books in manufacturing and more recently, the services industry. This year’s numbers have been accompanied by surging inflationary pressures which reached peaks last March (2021). Although at the time, financial markets were positioning for continued price rises, interest rate rises and a weakening US$ dollar. However, the reality was quite the opposite.
In this year’s annual report, we commented – ‘…we know that such statistics can be misleading when it comes to timing imbalances that eventually lead to directional change, but sentiment data like this can be used in conjunction with Elliott Wave analysis which we can confirm shows that dollar oversold condition is about to change with significant corrective rallies already underway. The US$ dollar index is forecast up to 95.85+/- over the next 5-6 months, maybe even higher’.
US$ Dollar Index Performance
The US$ Dollar Index has certainly put in a base-line low last January at 89.21 and it’s been engaged in a counter-trend rally since, trading so far to 93.43. This rally is far from over, where upside targets of 95.85+/- are little changed, currently at 96.15+/-.
Interest Rates Performance
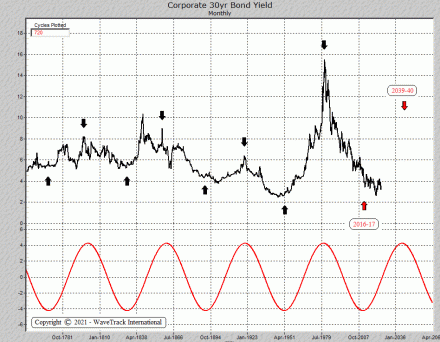
And for Interest Rates, a pause in those inflationary pressures was forecast basis analysis in the US10yr treasury yield and the Inflation TIPS, commenting – ‘…Whilst the long-term trends show a new 30+ year uptrend cycle for global interest rates, including treasury yields began from before last year’s COVID-19 pandemic lows, it is due to take a breather over the next 5-6 months…It’s necessary for a counter-trend 2nd wave downswing to now unfold. This suggests a temporary unwinding of the ‘Reflation-Trade’.
Exactly right! – the US10yr yield hit a peak last March at 1.774% per cent and has since traded down to .131%. So what can we expect next?
EW-Forecasts H2 2021
A lot of the normal correlations between the different asset classes have broken down this year. At the time of major turning points last year, in March’s ’20 pandemic highs/lows, the US$ Dollar hit a peak at 102.99 whilst stock markets like the benchmark S&P 500 traded to a low of 2191.86. The US$ dollar then declined into a five wave impulse pattern, ending last January ’21 at 89.21 and since trading higher into a correction. Yet, U.S. stock indices have yet to complete their corresponding advances although they’re expected at the end of August. But that means the normal correlation between these two asset classes have diverged for almost 8 months – see Fig #1.
Interest Rates
Interest rates bottomed into the March ’20 pandemic lows too with the US10yr yield hitting historical lows of 0.378% whilst the S&P 500 hit lows at 2191.86. But again, this relationship began to break down last March when the US10yr yield ended a its uptrend at 1.774 then declined earlier this month to 1.131 even though the S&P 500 has kept trending higher.
There’s also been a disruption in the way rising inflationary pressures have unfolded this year, in 2021. Investors surveyed last April by Bank of America showed 93% per cent were expecting the continuation of inflationary pressures – since then, rising food and agriculture prices (see PART II Commodities Report here) have exacerbated inflationary perceptions with lagging gains but with treasury yields declining over the past four months. However, that sentiment figure has now dropped to only 22% per cent.
The real difficulty in price forecasting is this divergence in ‘normal’ correlations. When they break down, it’s sometimes tricky to know how deep corrections can unfold if comparisons are removed from the equation – see Fig #1 – #2. This means that Elliott Wave patterns must be relied upon even if it sometimes doesn’t make sense.
What would happen next if interest rates bottom now completing those corrections?
Is that bullish or bearish for stock markets? And the next direction for stock markets remains critical in forecasting the US$ dollar’s next moves. Hypothetically, should stock markets correct by -30% per cent, as we see a heightened risk, that certainly translates into a higher US$ dollar but what about interest rates? Do they attract safe-haven buying, consistent with historical precedent? Or do interest rates surge higher because of another round of rising inflationary pressures, sending stock markets lower. You see the point – the recent breakdown in correlations makes it difficult to be sure.
Of all the movements in stock markets, commodities, currencies and interest rates, we can say with confidence that the US$ dollar is rated as the highest outcome basis the current Elliott Wave analysis depicting January’s correction continuing higher until October/November.
We’re updating some amazing Elliott Wave forecasts for Currencies and U.S. interest rates, US30yr, US10yr, US05yr and even US02yr together with a schematic look at several spread relationships with European rates not forgetting upside targets for the US10yr Inflation Tips and our attempt to solve this financial riddle – it’s a must-see!
We invite you to take this next step in our financial journey with us – video subscription details are below – just follow the links and we’ll see you soon!
Most sincerely,
Peter Goodburn
Founder and Chief Elliott Wave Analyst
WaveTrack International
What you get!
Contents: 127 charts | VIDEO DURATION: 2 hours 34 mins.
The contents of this CURRENCY & INTEREST RATES VIDEO include Elliott Wave analysis for:
Currencies (92 charts):
• US$ Index + Cycles
• Euro/US$ + Cycles
• Stlg/US$
• US$/Yen
• US$/CHF
• US$/NOK
• US$/SEK
• AUD/US$
• US$/CAD
• NZD/US$
• Euro/Stlg
• Euro/CHF
• Euro/NOK
• Euro/Yen
• Euro/AUD
• Euro/CNY
• Stlg/YEN
• Stlg/CHF
• Stlg/NOK
• Stlg/ZAR
• Stlg/AUD
• AUD/NOK
• CAD/NOK
• AUD/CAD
• AUD/NZD
• Asian ADXY
• US$/Renminbi
• US$/KRW
• US$/SGD
• US$/INR
• US$/TWD
• USD/THB
• US$/MYR
• US$/IDR
• US$/PHP
• USD/BRL
• USD/RUB
• US$/ZAR
• US$/MXN
• US$/TRY
• US$/PLZ
• Bitcoin
• Ethereum
Interest Rates (37 charts):
• US30yr Yield + Cycles
• US10yr Yield + Cycles
• US5yr Yield
• US2yr Yield
• US2yr-10yr Yield Spread
• US10yr-30yr Yield Spread
• 3mth EuroDollar-US10yr Yield Spread
• Comparison US10-DE10yr vs S&P 500
• US10yr TIPS Break Even Inflation Rate
• US10-DE10yr Yield Spread
• DE10yr Yield
• ITY10yr Yield
• JPY10yr Yield
How to buy the Currencies + Interest Rates Mid-Year Video Update 2021
Simply contact us @ services@wavetrack.com to buy the CURRENCIES + INTEREST RATES Video Outlook 2021 for USD 48.00 (+ VAT where applicable) or alternatively our Triple Video Offer for USD 96.00 (+ VAT where applicable) – Review the content of WaveTrack Stock Indices Video PART I here and the Commodities Video PART II here.
*(additional VAT may be added depending on your country – currently US, Canada, Asia have no added VAT but most European countries do)
VIMEO – For clients who wish to purchase our video directly online – the video will be available within this week on VIMEO! We will publish the vimeo link here and on our twitter account!
We’re sure you’ll reap the benefits – don’t forget to contact us with any Elliott Wave questions – Peter is always keen to hear you views, queries and comments.
Visit us @ www.wavetrack.com
Comments
Leave a Reply


