Currencies + Interest Rates Video Outlook 2021
by WaveTrack International| March 2, 2021 | No Comments
CURRENCIES and INTEREST RATES – PART III
US$ Dollar Index ends 9-Month Downtrend in January – Multi-Month Risk-Off/Safe-Haven Counter-Trend Rally Underway – Euro/US$ Hits Tops, Heading Lower in 5-6 Month Corrective Decline – Stlg/US$ Heading Lower – US$/Yen Higher with Yen Weakest in G10 – Commodity Currencies Set for 5-6 Month Corrective Declines – Asian ADXY Currencies begin Corrective Declines within Backdrop of Strengthening US$ Dollar – US10yr Treasury Yields Ending August ’20 Uptrend – Set for Multi-Month Correction – US10yr Breakeven Inflation TIPS ending Uptrend form March ’20 Lows – Reflation-Trade Unwinds over next 5-6 Months – DE10yr Yields Trending Higher but Beginning Corrective Downswing
INCLUDES ANALYSIS ON MAJOR US$ DOLLAR PAIRS/CROSSES – ASIAN/EM CURRENCIES – MEDIUM-TERM CYCLES – LONG-DATED YIELDS US/EUROPE/JAPAN + SPREADS
We’re pleased to announce the publication of WaveTrack’s annual 2021 trilogy video series of medium-term ELLIOTT WAVE price-forecasts. Today’s release is PART III, CURRENCIES & INTEREST RATES – Parts I & II were released during the last month – please contact us for information.
• PART I – STOCK INDICES – OUT NOW!
• PART II – COMMODITIES – OUT NOW!
• PART III – CURRENCIES & INTEREST RATES
CURRENCIES REVIEW – Highlights from Mid-Year 2020
• The US$ dollar index has resumed its 7.8-year downward cycle from March’s COVID-19 price-spike high of 102.99. Over the next several years, the dollar is forecast significantly lower as primary wave 3 gains downside momentum – forecasts towards 56.00+/-
• Shorter-term, the US$ dollar index is approaching downside targets towards 91.00+/- for the completion of an initial five wave impulse pattern from March’s 102.99 high. This combined with an extreme ‘oversold’ reading indicates a dollar counter-trend upswing will unfold for the next 2-3 months
The actual low in the US$ dollar index was 89.21, traded last January ’21. Since then, the dollar has begun a 5-6 month counter-trend rally which is forecast unfolding into a typical [a]-b]-[c] zig zag correction heading for the fib. 50% retracement area around 95.85/-. This is confirming a switch from the existing ‘Risk-On’ ‘Reflationary-Trade’ strategies to ‘Risk-Off’ ‘Reflationary-Trade Unwinding’ within a Safe-Haven period lasting into the end of Q3 2021.
Currencies – Key Drivers/Events for 2021
The US$ dollar has been declining for almost a year now, having ended a 2-year counter-trend rally peak into the March 20 COVID-19 pandemic peak of 102.99. At the core of this decline is the sheer amount of monetary and fiscal stimulus central banks and governments are willing to use to combat the effects of economic fallout due to the global coronavirus pandemic. The Federal Reserve and the new U.S. administration of Joe Biden are a good example – National Debt has surged higher to $27.86 trillion dollars – see fig #1.
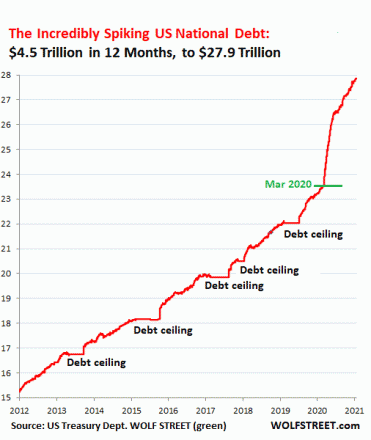
Fig #1 – US National Dept – WaveTrack International – Currencies and Interest Rates Video Outlook 2021
This chart courtesy of WolfStreet.com shows exactly what’s happened since March ’20, the cut-off line at the height of the coronavirus pandemic. The rise in debt has gone exponential since then, rising by $4.55 trillion in just under 12 months. That will undoubtedly cause rising inflationary pressures going forward, weakening the US$ dollar in the process.
EW-Forecasts for 2021
If you’ve tuned-in to our annual reports before, you’ll already know that the US$ dollar index is engaged in a 7.8-year cycle downtrend that began from the Jan.’17 high of 103.82. This is labelled as primary wave 3 within an Elliott Wave impulse downtrend that began from the July ’01 high of 121.02. You can probably imagine this means the dollar is set to decline rapidly over the next several years.
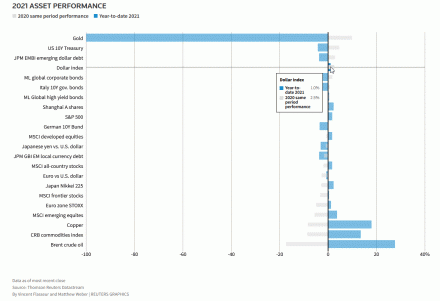
So far this year, over the past 8-weeks, the Asset Performance league table shows the US$ dollar index holding onto recent lows traded in early-January above its low of 89.21 – see fig #2. Gold features as the worst performer although that’s more to do with the fact that long-dated interest rates have been trending strongly higher. Otherwise, the star performers are commodities, the CRB index, Crude/Brent oil, Copper and to some extent, Emerging Markets. These have all continued advancing strongly in accordance to the existing ‘Risk-On’ ‘Reflationary-Trade’ strategies. But that’s about to change!
The Next 5-6 Months
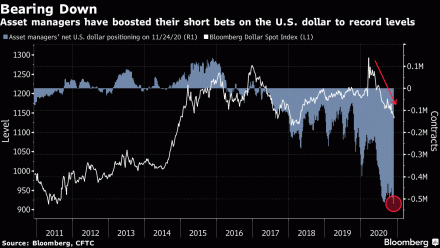
The US$ dollar remains very oversold, in fact, asset managers have increased their short-positioning to record levels in early-January – see fig #3. The numbers show in excess of -500,000 short contracts which was nowhere near levels seen back in 2011 when the dollar was actually trading a lot lower.
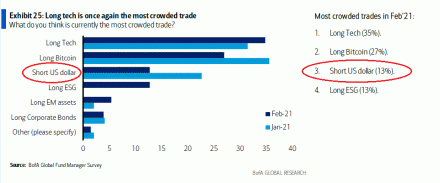
Furthermore, in its latest Fund Manager Survey, Bank of America/Merrill Lynch asked its fund manager clients what they considered the most crowded trades. In 3rd position was a Short-Dollar positioning with only Long Technology and Bitcoin ahead of it. That’s really something! See fig #4.
We know that such statistics can be misleading when it comes to timing imbalances that eventually lead to directional change, but sentiment data like this can be used in conjunction with Elliott Wave analysis which we can confirm shows that dollar oversold condition is about to change with significant corrective rallies already underway. The US$ dollar index is forecast up to 95.85+/- over the next 5-6 months, maybe even higher.
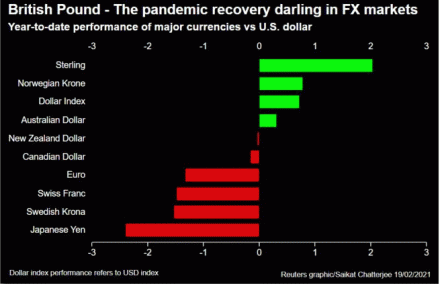
Ahead of this change, the best performing currency so far this year has been Stlg/US$ – see fig #5. That’s surprising when you consider this post-Brexit, but there you are! The Norwegian Krona is next in the league table, but that’s not surprising given the strength in Crude/Brent oil prices. In fact, all the commodity currencies in the G10- basket have done pretty well, especially since the March ’20 COVID-19 lows.
Latest Annual Report
The main theme for Currencies underlines the long-term downtrend of the US$ dollar within the backdrop of rising inflationary pressures but a 5-6 month period where this dissipates, where the dollar begins a counter-trend rally which means all the other dollar currency pairs with the G10 will decline into corrections during the same period.
Emerging Market currencies will decline over the next 5-6 months, as will nearly all Asian currencies we track within the ADXY basket. This report updates many currency crosses, totalling 98 charts!
Interest Rates
We know that long-dated interest rates are on the rise, capturing the headlines over recent weeks. This has caught the bond markets by surprise because of the commitment from the Federal Reserve and other central banks around the world including the ECB, Bank of Japan and Bank of China in maintaining unlimited monetary stimulus through bond purchases. But that hasn’t prevented the long-dated interest rate maturities from rising dramatically since January. The main reason is that investors are worried that reflationary pressures are exerting themselves with no end in sight.
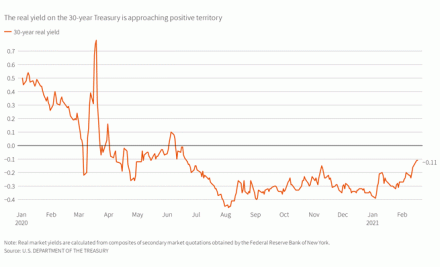
The ‘Real Yield’ as measured in 30yr treasuries is approaching zero 0.00% per cent having spent most of the time in negative since the COVID-19 pandemic broke last year – see fig #6. It was last year’s real yield plunge which sent cash flooding into stock markets. While expensive, they looked like a good deal compared with real yields of minus -1%. But fiscal stimulus and prospects of economic reopening have lifted real 30-year Treasury yields to eight-month highs, just 11 basis points shy of 0% and that’s what’s getting investors agitated. Could yields continue to exponentially rise? We think not!
Whilst the long-term trends show a new 30+ year uptrend cycle for global interest rates, including treasury yields began from before last year’s COVID-19 pandemic lows, it is due to take a breather over the next 5-6 months. The uptrend in the US10yr treasury yield has begun from last year’s historical low of 0.378% unfolding into a typical Elliott Wave 1-2-1 formation, a preamble to a strong multi-year uptrend. But the August ’20 advance from the secondary low of 0.500% has just completed a five wave impulse pattern into the late-February high of 1.554%. It’s necessary for a counter-trend 2nd wave downswing to now unfold. This suggests a temporary unwinding of the ‘Reflation-Trade’.
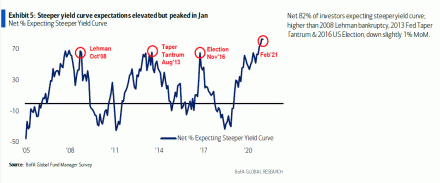
In Bank of America/ML’s GFM survey, the expectations of a steeper dollar yield curve are at levels above those during the Lehman bankruptcy crisis of 2008! See fig #7. That reflects just how bearish bond holders are, and conversely, why US10yr yields are too high at the moment. A contraction in the yield curve would almost certainly translate into a correction in benchmark US10yr treasury yields for the remainder of this year.
This latest annual report also examines the benchmark German DE10yr yield alongside the US10yr-DE10yr spread and Italian and Japanese yields/trends.
New Currencies & Interest Rates 2021 Video – PART III/III
We’ve amassed over 130 charts (a new record!!) from our EW-Forecast database in this year’s Currencies & Interest Rates 2021 video. Each one provides a telling story into the way Elliott Wave price trends are developing in this next INFLATION-POP’ phase of cycle development. We’re taking a look at some very specific patterns that span the entire 15.6-year US$ dollar cycle, explaining its current location and why inflation will trigger huge US$ dollar declines but simultaneously appreciating major Emerging Market and Asian Currencies.
We’re updating some amazing Elliott Wave forecasts for U.S. interest rates, US10yr, US10yr, US05yr and even US02yr together with a schematic look at several spread relationships with European rates not forgetting upside targets for the US10yr Inflation Tips – it’s a must-see!
We invite you to take this next step in our financial journey with us – video subscription details are below – just follow the links and we’ll see you soon!
Most sincerely,
Peter Goodburn
Founder and Chief Elliott Wave Analyst
WaveTrack International
What you get!
Contents: 130 charts | VIDEO DURATION: 2 hours 54 mins.
The contents of this CURRENCY & INTEREST RATES VIDEO include Elliott Wave analysis for:
Currencies (100 charts):
• US$ Index + Cycles
• Euro/US$ + Cycles
• Stlg/US$
• US$/Yen
• US$/CHF
• US$/NOK
• US$/SEK
• AUD/US$
• US$/CAD
• NZD/US$
• Euro/Stlg
• Euro/CHF
• Euro/NOK
• Euro/Yen
• Euro/AUD
• Euro/CNY
• Stlg/YEN
• Stlg/CHF
• Stlg/NOK
• Stlg/ZAR
• Stlg/AUD
• AUD/NOK
• CAD/NOK
• AUD/CAD
• AUD/NZD
• Asian ADXY
• US$/Renminbi
• US$/KRW
• US$/SGD
• US$/INR
• US$/TWD
• USD/THB
• US$/MYR
• US$/IDR
• US$/PHP
• USD/BRL
• USD/RUB
• US$/ZAR
• US$/MXN
• US$/TRY
• US$/PLZ
• Bitcoin
Interest Rates (30 charts):
• US30yr Yield + Cycles
• US10yr Yield + Cycles
• US5yr Yield
• US2yr Yield
• US2yr-10yr Yield Spread
• US10yr-30yr Yield Spread
• 3mth EuroDollar-US10yr Yield Spread
• Comparison US10-DE10yr vs S&P 500
• US10yr TIPS Break Even Inflation Rate
• US10-DE10yr Yield Spread
• DE10yr Yield
• ITY10yr Yield
• JPY10yr Yield
>How to buy the Currencies + Interest Rates Video Outlook 2021
Simply contact us @ services@wavetrack.com to buy the CURRENCIES + INTEREST RATES Video Outlook 2021 for USD 48.00 (+ VAT where applicable) or alternatively our Triple Video Offer for USD 96.00 (+ VAT where applicable) – Review the content of WaveTrack Stock Indices Video PART I here and the Commodities Video PART II here.
*(additional VAT may be added depending on your country – currently US, Canada, Asia have no added VAT but most European countries do)
We’re sure you’ll reap the benefits – don’t forget to contact us with any Elliott Wave questions – Peter is always keen to hear you views, queries and comments.
Visit us @ www.wavetrack.com
Comments
Leave a Reply
