COMMODITY Video Outlook 2021 | Part II
by WaveTrack International| January 22, 2021 | No Comments

‘FINAL STAGE of the COMMODITY ‘INFLATION-POP UPTREND’
THIS REPORT INCLUDES ANALYSIS ON MEDIUM-TERM CYCLES & EQUITY MINERS
We’re pleased to announce the publication of WaveTrack’s annual 2021 video updates of medium-term ELLIOTT WAVE price-forecasts. Today’s release is PART II, COMMODITY VIDEO OUTLOOK 2021 – Part I was released last month and Part III will be published in early-February.
• PART I – STOCK INDICES – out now!
• PART II – COMMODITIES – out now!
• PART III – CURRENCIES & INTEREST RATES – coming soon!
Commodity Elliott Wave Forecasts 2021 – Summary
• The Commodity Super-Cycle began from the Great Depression lows of year-1932, typically unfolding over the next 76-year period into an Elliott Wave impulse pattern ending in year-2008. Since then, a two-decade long corrective downswing has begun a new deflationary era but with pockets of rising inflationary pressures.
• Rising inflationary pressures began after the financial-crisis of 2007-09. The next stage resumed in early 2016, took a pause in 2018-2020 and is now set to surge higher through 2023/24 – this is the final stage of the ‘Inflation-Pop’ uptrend/cycle.
• Commodities have undergone extreme sell-offs during the COVID-19 panic that lasted through the first-quarter of 2020. Last January’s report cited a ‘Q1 Sell-Off’ prior to a major recovery. And that’s exactly what’s happened! All commodity sectors were hit hard, Base Metals, Precious Metals & Energy but especially Crude/Brent oil. Since then, major recoveries have begun and these are seen lasting into the next cycle peaks due in 2023/24.
• The US$ dollar resumed its 7.8-year cycle downtrend in March ‘20. An Elliott Wave 3rd-of-3rd wave is set to accelerate lower over the next several years. This becomes one of the main drivers that pushes commodity prices sharply higher.
• Shorter-term, commodity price advances from the March ’20 COVID-19 pandemic lows are approaching interim peaks having unfolded higher into five wave impulse patterns. A multi-month corrective downswing is forecast through Q1 and part of Q2 ’21 coinciding with a counter-trend rally/advance in the US$ dollar – begins a risk-off period.
• Base Metals Copper, Aluminum, Lead and Zinc have all trended higher from their March ’20 COVID-19 pandemic lows into five wave impulse patterns that are only now approaching completion. A multi-month correction is set to begin, pulling prices lower for several months.
• Precious Metals Gold and Silver both ended 3rd wave peaks last August ’20 and have since been engaged in multi-month counter-trend 4th wave declines. The price-extremities are lower for gold but already reached for silver. Gold is forecast lower into July ’21 basis its composite cycle. Platinum is expected to outperform gold but is also engaged in a counter-trend decline from its Jan.’21 high.
• Energy Price advances from the April ’20 lows for both Crude/Brent oil have unfolded into three wave A-B-C zig zag formations, ending right now, into January ’21 highs. A multi-month risk-off decline is forecast through to mid-year where prices retrace fib. 38.2% to max. 50% of the preceding advance from the COVID-19 pandemic lows. Thereafter, surging higher again through to 2023-24 as the final stage of the ‘Inflation-Pop’ uptrend/cycle.
Risk-Off Correction Beginning Q1 – ‘Inflation-Pop’ Uptrends Resume Q3
Commodities have surged higher over the past 10-month period having collapsed into important lows last year during the March ’20 COVID-19 pandemic. These advances represent the ‘Final Stage of the Inflation-Pop Uptrend’ which is poised to accelerate commodity prices significantly higher over the next several years.
The Elliott Wave pattern rhythm of Commodity price rises from the ‘Inflation-Pop’ lows of 2007-09. This is archetypically different to the same advance unfolding in global stock indices from the financial-crisis lows – see fig #1. This is often misunderstood. Yet, it can be explained from observing the historical long-term trends of both, from the Great Depression lows of 1932.
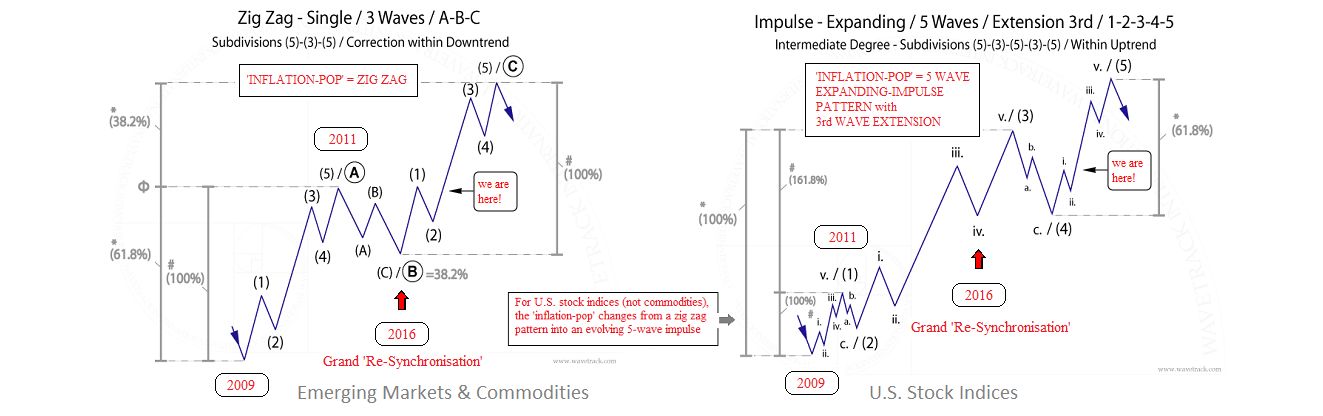
Fig # 1 – Inflation Pop vs. 5 Wave Impulse Pattern
When these two asset classes began long-term uptrends from 1932, they both unfolded into cycle degree five wave impulse patterns. This commodity super-cycle actually ended its five wave structure in year-2008. However, U.S. stock markets have continued their equivalent pattern higher. The financial-crisis sell-off into the late-2008/early-2009 lows triggered the beginning of a multi-decennial A-B-C expanding flat pattern for commodities, ending cycle wave A but this low was simply a 4th wave correction for stock markets. The next advance for commodities represents cycle wave B, itself a primary degree A-B-C zig zag (see tutorial chart) pattern destined for new record highs. Meanwhile, the same period for U.S. stock indices began a 5th wave which must ultimately subdivide into a five wave impulse pattern. Most importantly, these two differing Elliott Wave patterns have been unfolding ever since.
Positive Correlation
Their positive-correlation remained in sync during the initial ‘Inflation-Pop’ advance from 2009 to 2011 but then it broke-down for five years. It was necessary because commodity prices had to begin a corrective downswing as primary wave B. But for U.S. stock indices, they were simultaneously engaged in accelerative third-wave advances within the larger 5th wave uptrend. This disparity was eventually reconciled when both declined into formative lows in late-2015/early-2016. At the time, we described this event as the grand ‘Re-Synchronisation’.
Final Stage of the Inflation-Pop Uptrend
Since then, commodity prices, especially Base Metals and their corresponding Mining Stocks have traded higher in huge multiple gains. And those uptrends are still engaged to the upside. There was another sub-sector disparity which has subsequently been realigned when Energy contracts like Crude Oil and Brent oil collapsed last year, into the April ’20 COVID-19 lows. But advances in both underlying Base Metals and Energy contracts have since entered the Final Stage of the Inflation-Pop Uptrend’ which is poised to accelerate prices significantly higher over the next several years. So what is triggering these events?
Monetary & Fiscal Stimulus
Central banks have responded to the COVID-19 pandemic by significantly increase money supply – see fig #2.
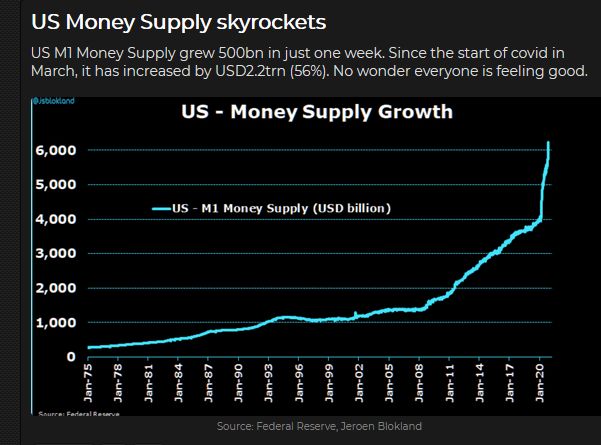
Fig #2 – Money Supply Skyrockets – Souce: Federal Reserve
The U.S. Federal Reserve alone has increased M1 money supply so much the figures saw an increase of $2.2 trillion dollars, a sudden jolt to existing debt representing a 56% per cent increase. With so much money sloshing around, its no wonder that asset prices are rising across-the-board.
Commodity Outlook 2021 and the US$ Dollar Outlook
One contributor that’s expected to drive asset values significantly higher over the next few years is a weakening US$ dollar – see fig #3. There’s a distinct 15.6-year cycle recurrence for the US$ dollar index which has signalled the various peaks and troughs over the past several decades. In this updated cycle, the length of the interval has been increased to 16.25 years in order to align the cycle-troughs of the late-1970’s, mid-1990’s, early-2010’s into the next major lows of 2027.
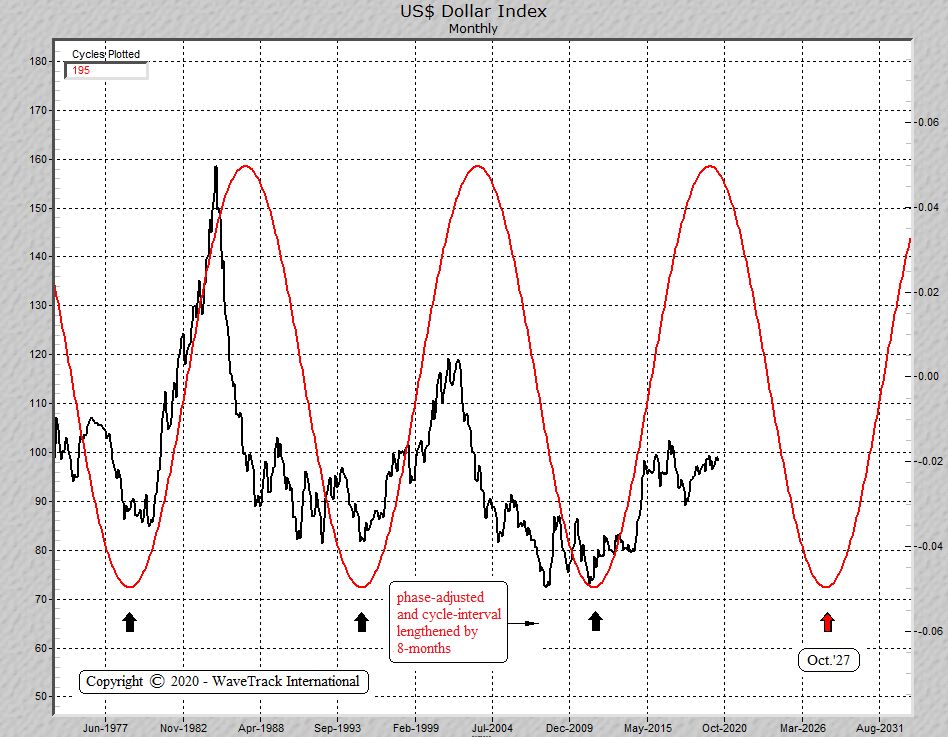
Fig #3 – US Dollar Index – Monthly Cycle by WaveTrack International
Such US$ dollar declines are shown unfolding as the final sequence of the dollar index’s cycle degree A-B-C downswing that began from all-time-highs of 164.72 that peaked back in February 1985 – see fig #4. Looking ahead over the next several years, we expect the dollar to decline rapidly. To be exact, around -45% per cent fuelling the final stage of the commodity inflation-pop. Downside targets are towards 56.08+/- and ultimately 49.34+/-.
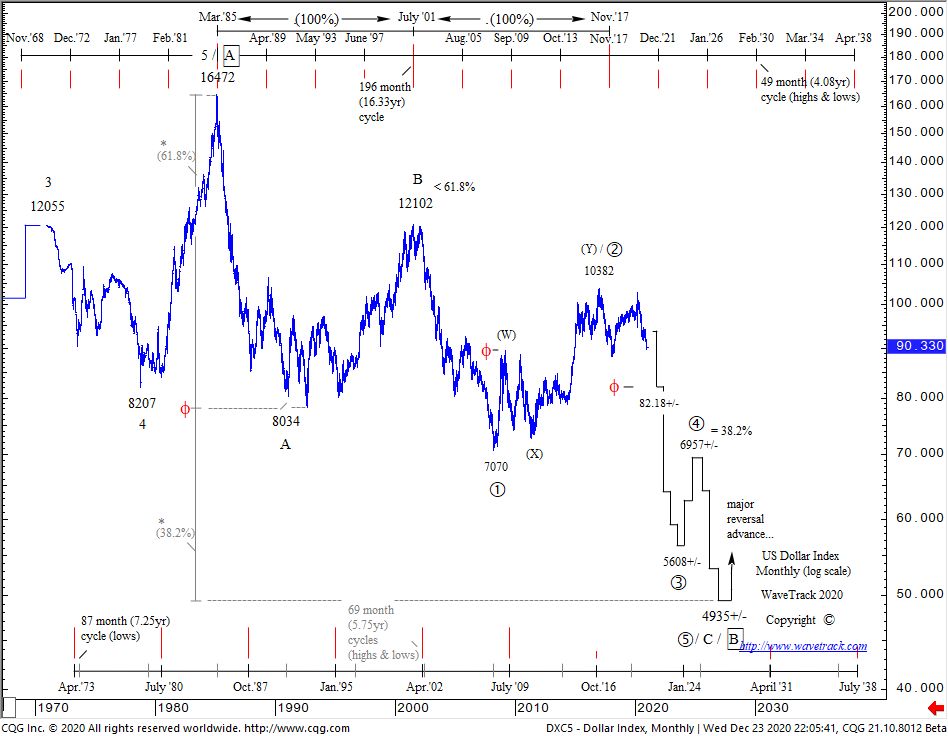
Fig #4 – US Dollar Index – Monthly Elliott Wave Forecast by WaveTrack International
Risk-Off Correction Beginning Q1 2021
Before commodity prices resume their inflation-pop uptrend, there’s going to be a risk-off correction beginning Q1 ’21 lasting though to mid-year. What triggers this? Most probably, a US$ dollar counter-trend rally!
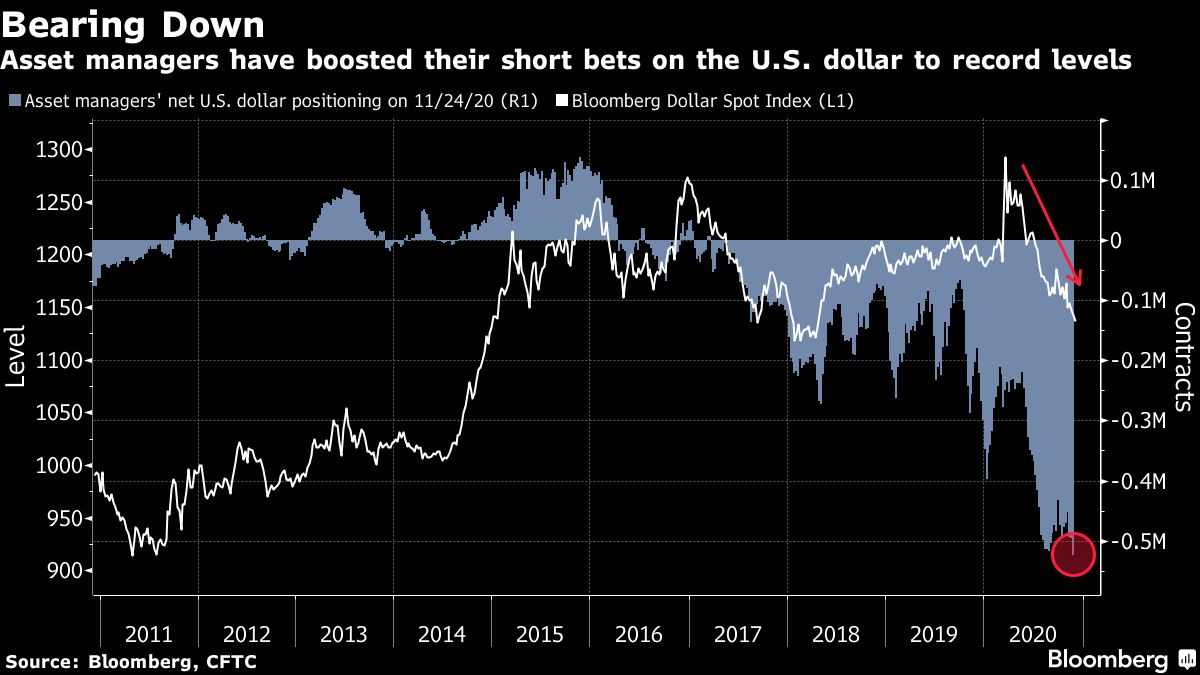
Fig #5 – USD Short Positioning – Source: Bloomberg
Asset managers have a net U.S. dollar positioning at extreme record lows – see fig #5. That alone suggests the dollar index will soon begin a multi-month counter-trend rally. But does this corroborate with Elliott Wave and cycle analysis? Yes, the daily composite cycle is forming an important low right now, into January 2021 – see fig #6. Moreover, from an EW perspective, the index’s decline from the March ’20 COVID-19 peak of 102.99 is ending a five wave impulse pattern at January’s low of 89.21. This confirms a dollar risk-off/safe-haven phase has begun, lasting through to mid-year, maybe longer? That would certainly cause commodity prices to undergo significant corrective declines.
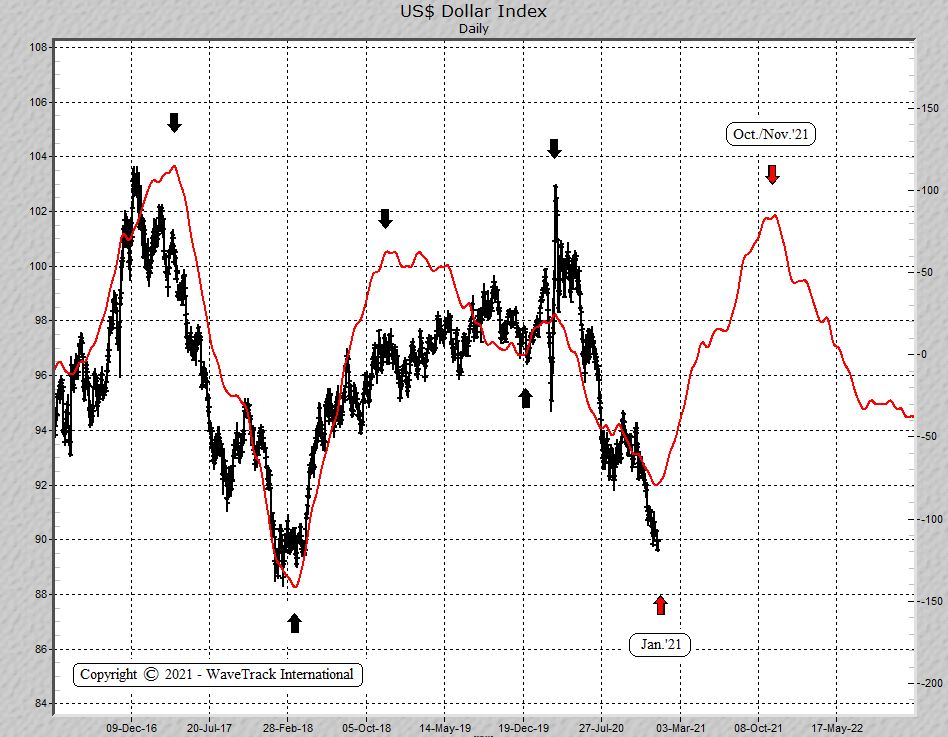
Fig #6 – US Dollar Index – Daily – Cycle by WaveTrack International
We can’t always know what fundamentals trigger such events, but a good guess is another downturn in global economic activity as COVID-19 second-phase lockdowns continue for another few months.
Commodity Deflation/Inflation
Another indication of risk-off during the next several months comes from interpreting Bank of America’s deflation/inflation data as a ‘contrarian’ indicator – see fig #7. Bank of America lists inflation assets as commodities, real estate, Treasury inflation-protected securities (TIPS), U.S. banks and value stocks. Deflation assets include government bonds, corporate bonds, the S&P 500, and growth stocks.
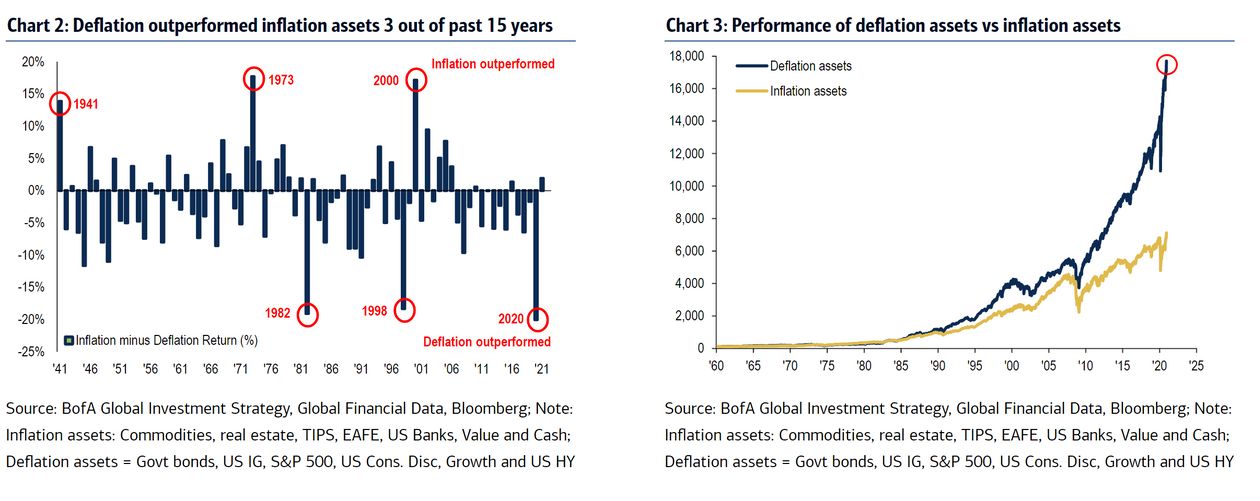
Fig #7 – Deflation Outperformed Inflation Assets – Source: Bank of America
They report that inflation assets are outperforming deflation assets by the most since 2006 and that’s a direct result of large asset managers believing the central bank and fiscal stimulus narrative and consequently buying undervalued assets. This really began last August/September ’20 – up until then, asset managers were expecting a double-dip recession but they quickly changed tack afterwards and have since binged on buying these inflationary assets, particularly commodities and emerging markets – see fig #8. Just last week saw the second-largest inflow to energy stocks, the third-largest inflow to Treasury inflation-protected securities, sixth-largest inflow to emerging markets, and the largest inflows to bank loans in nearly four years, according to the Bank of America data. Municipal bonds, which are exempt from federal and most state taxes, saw record inflows.
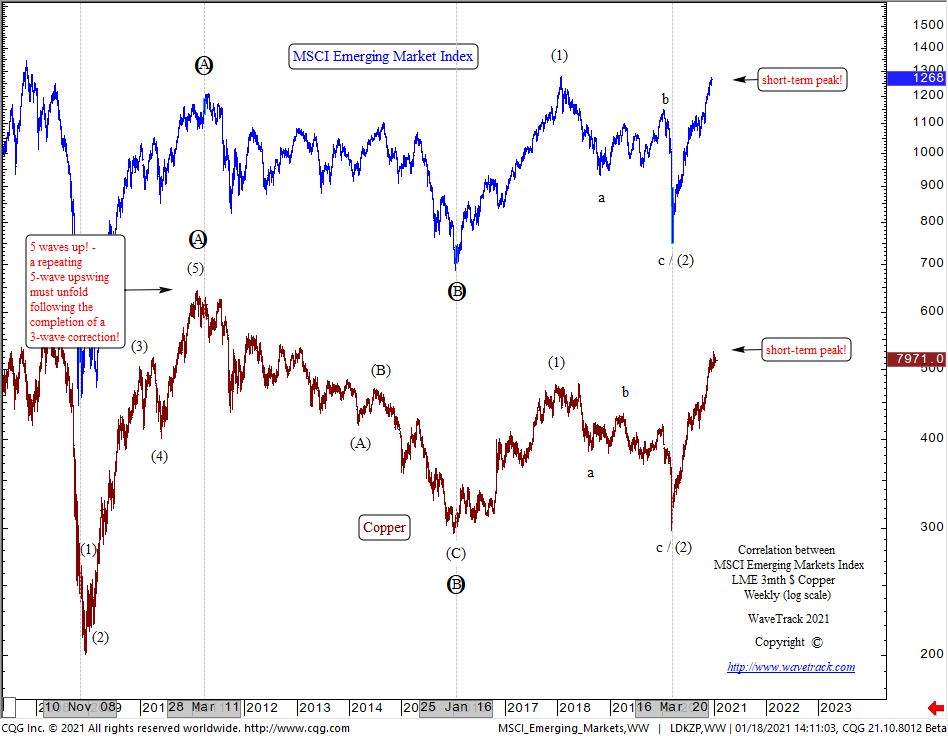
Fig #8 – MSCI Emerging Markets Index vs. Copper – Correlation Study by WaveTrack International
And to a point that now looks like an extreme – from a contrarian standpoint, a ripe environment for a correction to begin in 2021!!
Commodities – Copper, Gold & Energy
Copper prices have advanced from their March ’20 COVID-19 lows to begin the final stage of the ‘Inflation-Pop’ uptrend/cycle. Elliott Wave analysis forecasts new record highs over the next several years leading into the expected peak around 2023-24. But shorter-term, a correction lasting for the next several months is about to get underway in response to finishing a five wave impulse uptrend.
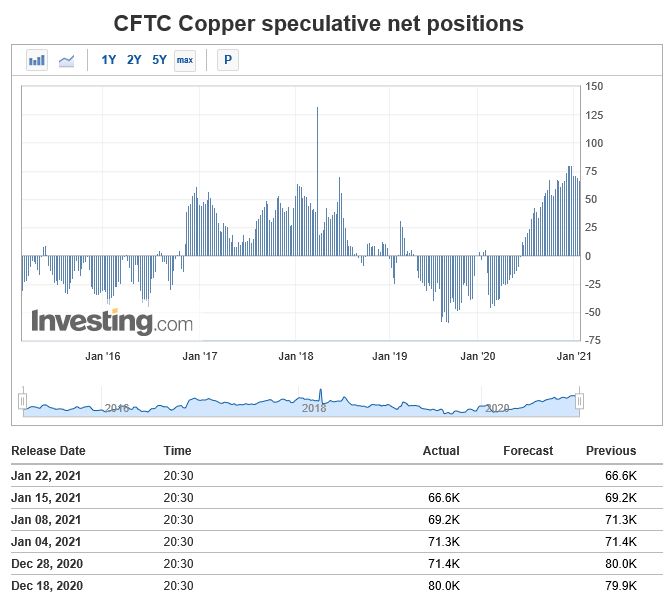
Fig #9 – CFTC Copper Speculative Net Positions – Source: Investing.com
The latest CFTC data shows frothy net speculative long positioning at 66,600 contracts, historically high – see fig #9. That’s down from 80,000 late-December but still well above 5-year highs, an early-warning that prices are a little top-heavy.
US 10yr Tips
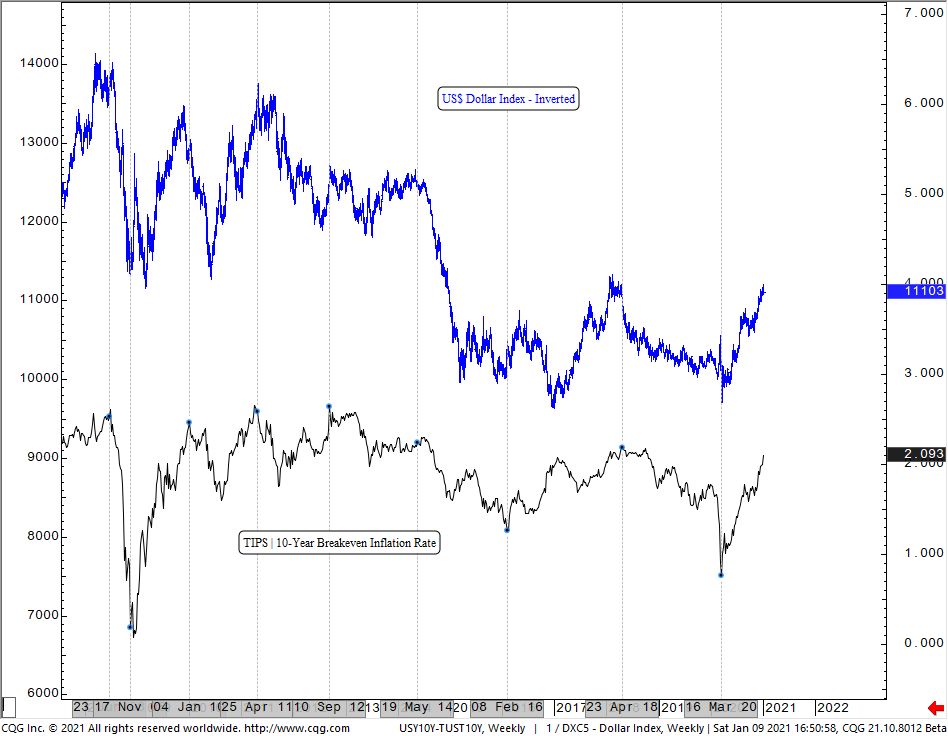
Fig #10 – US 10yr TIPS vs. US Dollar – Correlation Study by WaveTrack International
The US10yr breakeven inflation rate yield is also looking stretched to the upside – see fig’s #10 & #11.

Fig #11 – US10yr – USTIPS10yr – Yield Spread by WaveTrack International
Note the inverted correlation with the US$ dollar index which is already showing signs of beginning a multi-month upside risk-off correction. And from an Elliott Wave perspective, it has trended higher from the March ’20 COVID-19 lows of 0.558 into a five wave impulse pattern that is close to upside completion. A multi-month correction is about to begin, lasting several months before resuming its larger inflationary uptrend.
Gold
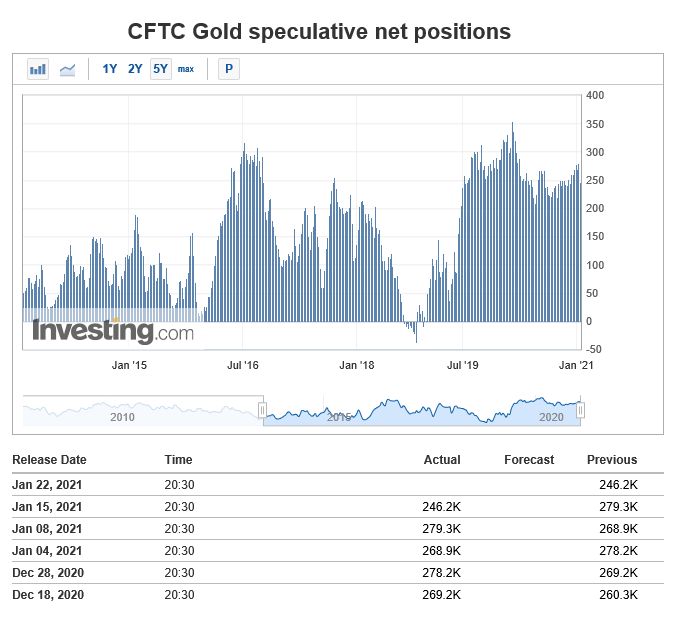
Fig #12 – CFTC Gold Speculative Net Positions – Source: Investing.com
Gold is an interesting commodity which attracted huge bullish interest last July/August. Although bullion prices traded up to new record highs last August, to 2072.12, prices have since begun counter-trend corrections. The latest CFTC shows how that peak coincided with peaks in net speculative long positioning although below record highs – see fig #12. Our cycle analysis also points towards more price declines through to July ’21 – see fig #13. And from an Elliott Wave perspective, gold is heading lower as wave (A) within a 4th wave correction but itself part of a five wave impulse uptrend that began from the Dec.’15 lows. That could keep gold range-trading for some time.
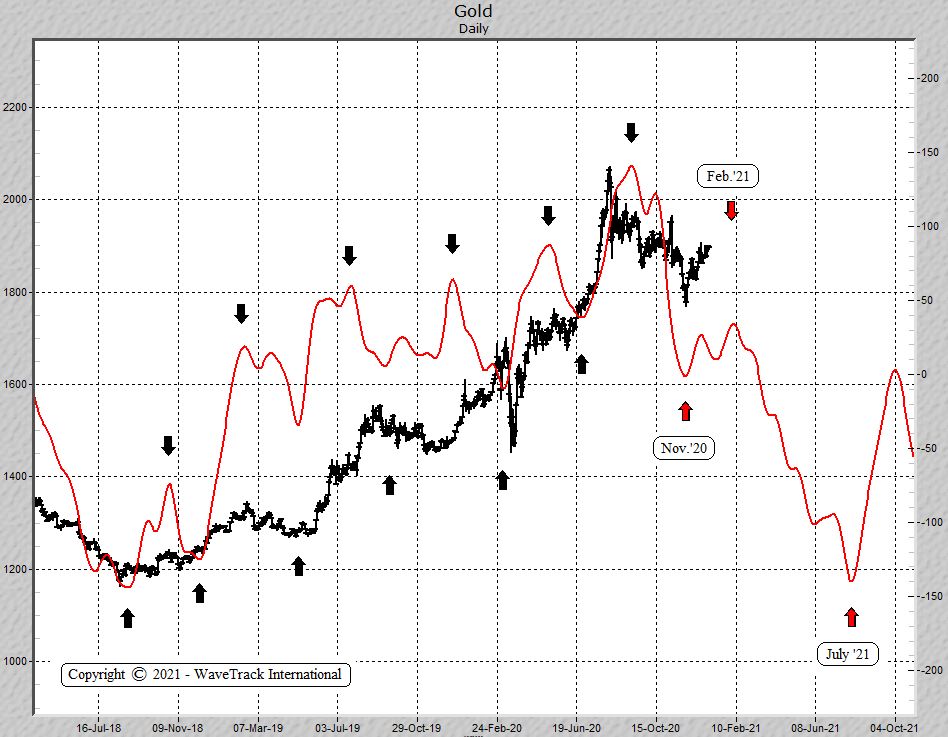
Fig #13 – Gold – Daily – Composite Cycle by WaveTrack International
Energy
In the energy sector, we’ve updated Crude/Brent oil showing how last year’s major declines ended super-cycle wave A from the all-time-highs of July ’08. Wave A is the first sequence in a very long-term triangle pattern where wave B is currently engaged in an ‘Inflation-Pop’ rally. However, we don’t expect wave B to reach new record highs because it’s showing early signs that it’s developing higher into a double zig zag pattern where the first cycle degree A-B-C zig zag is ending right now – so watch out for a multi-month correction!

Fig #14 – Largest Energy Sector Inflow since 2008 – Source: Bank of America
A correction seems possible when we look at the latest Bank of America survey – see fig #14. This shows the largest inflow into energy stocks since 2008 – okay that’s not the underlying commodity but the positive-correlation remains constant.
New Commodity 2021 Video – PART II/III
We’ve amassed over 90 commodity charts from our EW-Forecast database in this year’s Commodities 2021 video!! Each one provides a telling story into the way Elliott Wave price trends are developing in this next ‘INFLATION-POP’ phase of cycle development. We’re taking a look at some very specific patterns that span the entire SUPER-CYCLE, explaining why the super-cycle began from the GREAT DEPRESSION lows of 1932 and not from the lows of 1999 and how this ended in 2006-2008 and why the multi-decennial corrective downswing that began soon afterwards is taking the form of a very specific, but identifiable Elliott Wave pattern.
We invite you to take this next step in our financial journey with us – video subscription details are below – just follow the links and we’ll see you soon!
Most sincerely,
Peter Goodburn
Founder and Chief Elliott Wave Analyst
WaveTrack International
Commodities Video Part II
Contents: 92 charts
Time: 2 hours 25 mins.
• CRB-Cash index + Cycles
• US Dollar index + Cycles
• DB Agriculture Fund
• Copper + Cycles
• Aluminium
• Lead
• Zinc
• Nickel
• Tin
• XME Metals & Mining Index
• BHP-Billiton
• Antofagasta
• Anglo American
• Kazakhmys Copper
• Glencore
• Rio Tinto
• Teck Resources
• Vale
• Silver/Copper Correlation Study
• Gold + Cycles
• GDX Gold Miners Index
• Newmont Mining
• Amer Barrick Gold
• Agnico Eagle Mines
• AngloGold Ashanti
• Silver + Cycles
• XAU Gold/Silver Index
• Platinum
• Palladium
• Crude Oil + Cycles
• Brent Oil
• XOP Oil and Gas Index
• Natural Gas
How to buy the Commodity Video Outlook 2021
Simply contact us @ services@wavetrack.com to buy the COMMODITY Video Outlook 2021 for USD 48.00 (+ VAT where applicable) or alternatively our Triple Video Offer for USD 96.00 (+ VAT where applicable) – Review the content of WaveTrack Stock Indices Video PART I here. The last part of our Triple Video Series for Currencies and Interest Rates will be available approx. February/March 2021.
*(additional VAT may be added depending on your country – currently US, Canada, Asia have no added VAT but most European countries do)
We’re sure you’ll reap the benefits – don’t forget to contact us with any Elliott Wave questions – Peter is always keen to hear you views, queries and comments.
Visit us @ www.wavetrack.com
Comments
Leave a Reply

Recent Posts
Recent Comments
Archives
- February 2026
- December 2025
- August 2025
- July 2025
- June 2025
- March 2025
- February 2025
- January 2025
- December 2024
- August 2024
- July 2024
- June 2024
- May 2024
- April 2024
- February 2024
- January 2024
- December 2023
- August 2023
- July 2023
- June 2023
- March 2023
- February 2023
- January 2023
- December 2022
- November 2022
- October 2022
- August 2022
- July 2022
- June 2022
- May 2022
- March 2022
- February 2022
- January 2022
- December 2021
- August 2021
- July 2021
- June 2021
- March 2021
- February 2021
- January 2021
- December 2020
- November 2020
- August 2020
- July 2020
- June 2020
- May 2020
- April 2020
- March 2020
- February 2020
- January 2020
- December 2019
- October 2019
- September 2019
- July 2019
- June 2019
- May 2019
- April 2019
- March 2019
- February 2019
- January 2019
- December 2018
- November 2018
- September 2018
- August 2018
- July 2018
- June 2018
- May 2018
- April 2018
- March 2018
- February 2018
- January 2018
- December 2017
- November 2017
- October 2017
- September 2017
- August 2017
- July 2017
- June 2017
- May 2017
- March 2017
- February 2017
- January 2017
- December 2016
- November 2016
- October 2016
- September 2016
- August 2016
- July 2016
- June 2016
- May 2016
- April 2016
- March 2016
- February 2016
- January 2016
- December 2015
- November 2015
- October 2015
- September 2015
- August 2015
- July 2015
- June 2015
- May 2015
- April 2015
- March 2015
- February 2015
- January 2015
- December 2014
- November 2014
- October 2014
- September 2014
- August 2014
- July 2014
- June 2014
- May 2014
- April 2014
- March 2014
- February 2014
- January 2014
- December 2013
- November 2013
- October 2013
- September 2013
- August 2013
- July 2013
- June 2013
- May 2013
- April 2013
- March 2013
- February 2013
- January 2013
- December 2012
- November 2012
- October 2012
- September 2012
- August 2012
Categories
- ADXY Index
- Agnico Eagle Mines
- AI Artificial Intelligence
- Alcoa
- Amazon
- AngloGold Ashanti
- Antofagasta
- APPL
- Apple
- ASX 200
- AUD vs USD
- AUDNZD
- AUDUSD
- Australia ASX 200
- Baltic Dry Index
- Banking
- Base Metals
- Biotechnology
- Bitcoin
- Bovespa
- Broadcom
- Catalexit
- central banks
- Christmas
- Commodities
- Commodities Video Outlook 2020
- Conference
- Copper
- Coronavirus Sell-Off
- CRB
- Crude oil
- crude oil price chart
- CryptoCurrency
- Currencies
- Currencies + Interest Rates Video Outlook
- Cycles
- Dax 30
- deutsche bank
- Dewey Cycle
- DJ Transportation Average
- DJ Utilities
- Dow Jones 30
- Dow Theory
- ECB
- economy
- Elliott Wave
- Elliott Wave Charts
- Elliott Wave Patterns
- Elliott Wave Principle
- Emerging Markets
- Ending-Diagonal Elliott Wave Pattern
- Equity
- EUR vs CHF
- EUR/USD
- Euro / US$
- Eurostoxx 50
- EuroStoxx50
- EuroStoxxBanks
- EURUSD
- Expanding Flat Pattern
- FAAMG
- FANG+
- fib-price-ratio
- Fibonacci Trading
- Fibonacci-Price-Ratio
- Financial Forecasting
- Fixed Income
- forex
- Freeport McMoran
- FTSE 100
- Fund Management
- FX
- FXStreet
- GBP/AUD
- GBP/USD
- GDX
- GDXJ
- Germany 10 year Euro Bund future
- Gilead Sciences
- Glencore
- Global Economy
- Gold
- Gold Mining
- Golden Ratio
- goldman sachs
- Google Inc.
- Google/Alphabeth
- Greek debt crisis
- Hang Seng
- Harbinger
- Hungarian Forint
- IBEX 35 Index Spain
- Independent Research
- India-CNX Nifty 50
- Interest Rates
- Interview
- IRP Independent Research
- kbw bank index
- Lonmin
- MAG-7
- McDonald's
- MID-YEAR VIDEO UPDATE!
- Mifid II
- Mines
- Mining
- MSCI China
- MSCI Emerging Markets
- Nasdaq 100
- Nasdaq Biotechnology Index
- Nasdaq Composite
- Nasdaq100
- Netflix
- Newmont Mining
- Nikkei 225
- NVIDIA
- NYSE Composite Index
- Palladium
- Platinum
- Precious Metals
- Ralph Nelson Elliott
- Reversal-Signature
- Russell 2000
- Russia RTS
- S&P 500
- Sector
- Secular-Bull
- Sentiment Survey
- Shanghai Composite Index
- Silver
- Slanting Flat Elliott Wave Pattern
- SP100
- SP400 Mid-Cap
- SP500
- SPX 500
- STLG/AUD
- Stlg/US$
- STLG/USD
- STLG/YEN
- STLG/ZAR
- Stock Index
- Stock Index Tracking
- Stock Index Video
- Stock Indices
- Stock Indices Video Outlook 2023
- Stock Indices Video Outlook 2025
- Sugar
- Summary
- Tesla
- Tesla Inc
- Toyota
- Track Record
- trading
- Trusts
- Tutorial
- Uncategorized
- UniCredit
- US
- US Dollar Index (DXY) (USDX)
- US$ Index
- US-Dollar Index
- US10yrYields
- USD
- USD/ARS
- USD/CNY
- USD/IDR
- USD/INR
- USD/MXN
- USD/SGD
- USD/THB
- USD/YEN
- USD/ZAR
- Vale
- Value Line Index
- video
- VIDEO OUTLOOK 2018
- VIDEO OUTLOOK 2020
- VIX
- W.D. Gann
- WaveTrack International
- XAU Gold/Silver Index
- Xetra Dax
- XOP
- Yields
- Zig Zag
- Zinc
- ‘INFLATION-POP’
- ‘SHOCK-POP-DROP’