BOVESPA – How to time the S&P 500 turn!
by WaveTrack International| January 23, 2018 | No Comments
U.S. stock indices are stretching ever higher whilst setting quite a few records into the end of 2017. Last year, it gained in each month, something never done before. And as for January 2018, it’s one of the longest runs in history without a -3% per cent correction!
We’re setting a few records in terms of Elliott Wave analysis and Fibonacci-Price-Ratios too! This is significantly evident in the way the S&P has run higher from last August’s low of 2415.75 (futures). This five wave impulse pattern is labelled as minuette wave [v]. The fifth wave within the larger 3rd uptrend that began from the June ’16 Brexit low. It started subdividing into a series of 1-2’s, three sequences in all prior to undergoing what we term as ‘price-expansion’ which defines the 3rd-of-3rd-of-3rd wave sequence.
Setting Fib-Price-Ratio Records!
There’s a high-occurrence statistic associated with impulse patterns that undergo several degrees of subdivision. This is where the 1-2-1-2-1 sequence is extended by a fib. 161.8% ratio in projecting the terminal high for the entire pattern through each degree of trend, i.e. to finish the entirety of minuette wave [v]. Consequently, this projected the exact high traded on December 4th 2017 at 2665.25. But the uptrend didn’t finish there, and this is why it’s setting some fib-price-ratio records too! It’s very rare for an index to extend beyond such measurements. The only occasion we’ve recorded a previous event was in the run-up to ending the great bull market uptrend of the 1990’s! So this current pattern will go into our archives!
What Next?
The next series of fib-price-ratio measurements extend the 3rd-of-3rd-of-3rd wave high traded at 2577.25 (Oct. 23rd) by a fib. 161.8% ratio which projects a terminal high at 2861.75+/-. We notice a fib-price-ratio convergence-matrix at the 2860.00+/- area from measuring December’s final impulse wave upswing and the minuette degree impulse from the June ’16 Brexit low, so there is good reason to think the index will complete and stage a reversal-signature at this upside area.
Bovespa
In order to verify an upside exhaustion for the S&P 500 like this, it must be corroborated by comparing the progress and pattern development of various complimentary, but different indices. One interesting proxy that might just assist in timing the turn for the S&P is Brazil’s Bovespa.
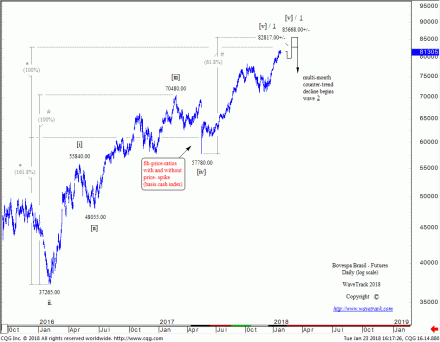
In this chart, you’ll notice a clean five wave impulse pattern unfolding higher from the Feb.’16 low of 37265.00 – see fig #1. There’s no record-setting gains or unique or rare fib-price-ratio’s here – plain and simple! The only complexity is the price-spike low traded in the 4th wave correction in May ’17. If the extremity of this is used, then a final 5th wave can unfold by a fib. 61.8% ratio of the 1st-3rd waves ending at 85668.00+/-. That’s not too far above current levels. And even nearer if the price-spike is filtered to its closing level – extending waves [i]-[iv] by a fib. 61.8% ratio would project a terminal high for wave [v] towards 82817.00+/-.
Conclusion
The Bovespa is approaching an important peak with a multi-month correction due to begin afterwards. That would pull prices significantly lower until mid-year. The exact timing of this correction can be used to help pinpoint the next peak for the S&P – and it’s not too far away anymore!
Don’t forget to subscribe to our bi-weekly reports for updated ELLIOTT WAVE forecasts on these indices and their next price developments!
Good luck and best wishes,
Peter Goodburn
WaveTrack International
PS: If you want to find out WaveTrack’s long-term trends for global financial STOCK INDICIES dont’t forget to check our latest STOCK INDICES video. Published only twice a year!
Comments
Leave a Reply

