MAGICAL 7 – Cycle Declines in 7th Year of Decade
by WaveTrack International| October 3, 2017 | 5 Comments
The 7th Year Cycle
Richard Mogey is a former Executive Director of the Foundation for the Study of Cycles and is one of the world’s foremost cycle analysts with over 50-years’ experience. His latest weekly cycle analysis has taken an in-depth look at the evidence surrounding the 7th Year Cycle in the stock market and asks the question – does the 7th year really show a strong dip in price levels on a consistent basis?
In a nutshell, yes, there is evidence that a strong sell-off does occur in the 7th year of the decade – Richard adds though that out of the 21 ‘seventh-year’ examples that begins from the year 1793, 9 do not conform to the recurrence of a strong sell-off, equivalent to 42% per cent.
7th Year Cycle Research basis Dow Jones (DJIA)
In order to gain a true representation of like-for-like comparison, Richard has converted the Dow Jones (DJIA) data into logs then into a rate-of-change. This certainly helps in evaluating which of the 7th years in each successive decade fulfilled the criteria of staging a strong sell-off and those that didn’t.
A few aspects that became obvious to me in the analysis was that in those years where a 7th year did stage a mini-crash, this generally occurs into the last quarter of the year. Some did form a cycle-trough slightly earlier, but those that did fit the model ‘perfectly’ generally began those declines a few months previously.
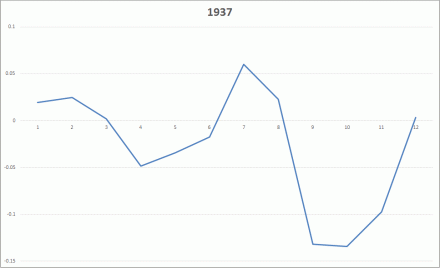
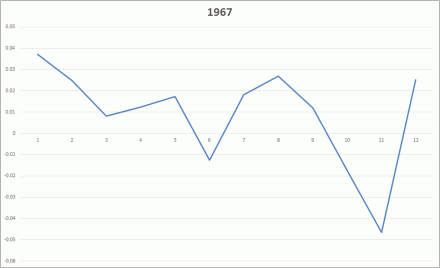
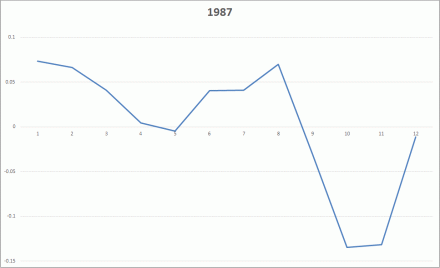
Here are a few examples of the ‘prefect’ modelling from Richard’s analysis (fig’s # 1-3):
Note that the peaks form in July/August, bottoming October/November.
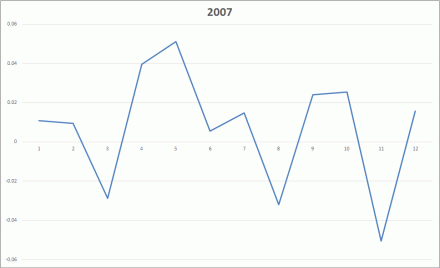
Now take a look at the previous 7th year cycle of 2007 – see fig #4.
It didn’t quite unfold into the ‘idealised’ pattern frequency as the preceding peak occurred much earlier in the year in May forming two lows later, in August and eventually in November. But overall, it fulfilled the basic criteria of the form.
Richard concluded that this year’s stock market has had a straight-line upward trajectory since last year’s Presidential election so the available time remaining to fulfil a strong sell-off is now quite short as we enter the final quarter of this 7th year. If 2017 is going to be the thirteenth year that fulfils the strong sell-off criteria, then it would have to begin almost straight away.
Certainly, there is downside risk in this cycle’s analysis, but can Elliott Wave analysis clarify the probabilities?
Elliott Wave – Approaching 3rd Wave Peak
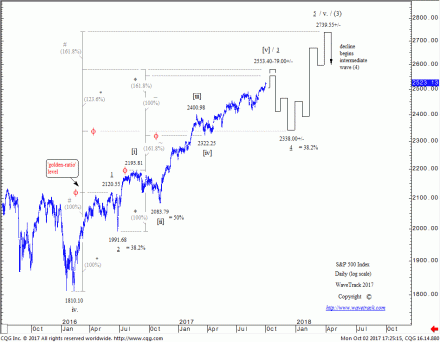
In WaveTrack International’s recent updates of the Elliott Wave Navigator and Elliott Wave Compass reports, the S&P’s upside progress from the grand ‘RE-SYNCHRONISATION’ lows of Feb.’16 illustrates an incomplete five wave ‘expanding-impulse’ pattern in upward progress. But it is approaching a terminal high for its 3rd wave sequence. See fig #5.
At the moment, the S&P is still pushing to higher-highs, to new record highs, but the upside targets to complete its 3rd wave which began from the June ’16 Brexit low of 1991.68 are fast being approached. Is this Richard’s 7th year cycle peak coming to fruition? If so, it’s several months late.
We believe this will trigger a strong sell-off as a 4th wave correction unfolds – the exact same Elliott Wave pattern is also visible in the Dow Jones (DJIA) – watch for resistance towards 22750.00 to 22800.00+/-.
For the S&P 500, a 4th wave correction would pull prices down towards the fib. 38.2% retracement level at 2338.00+/-. Depending on exactly where the 3rd wave peaks, towards 2553.00-2580.00+/-, this is about an -8% or -9% per cent correction. That would certainly conform to Richard’s criteria for adding 2017 as one of those 7th years that resulted in a strong sell-off.
After the 7th Year Cycle Lows
Now the good news (especially for portfolio fund managers and long-only funds!) – Richard adds that once the strong sell-off is over, the markets recover again but not into a correction but into higher-highs. He estimates the next advance is good for a +10% to +12% per cent gain.
From an Elliott Wave perspective, that would fit perfectly into the development of a final 5th wave advance, which projects the S&P 50 towards 2739.55+/- sometime into the end of Q1 2018.
So there we have it. There is definitely some downside risk for U.S. and global stock markets as we enter into this final quarter of the 7th year of this decade. I would add that Richard says that if a more imminent decline is avoided, the Dow Jones (DJIA) could easily stretch this year’s gains by another +8% to +10% per cent. Either way, a little piece of history is expected to be made before the year end – and you can probably guess which way I’m expecting the markets to trade!
If you wish to know more about Richard Mogey’s amazing work and CycleTech software you can contact him here:
Richard Mogeys Cycle work and CycleTech Software
email: rmogey@comcast.net
Learn more about Richard Mogey’s background
Richard Mogey, one of the world’s foremost authorities on cycles, has been studying cyclic activity in disciplines from natural phenomena to financial markets. He is a direct heir to the philosophy of Edward R. Dewey who founded the Foundation for the Study of Cycles.
From 1988 to 1997 Mr. Mogey was the Research Director, Executive Director, Chief Financial Officer, and Chief Economist for the original “Foundation for the Study of Cycles, Inc.”, an international nonprofit research organization. He was the chief statistician and economist at the Foundation from 1989 to 1997. He created and co-authored two magazines for investors, Business and Investment Cycles and Cycles Projections, and was responsible for the editorial content of the popular journal, Cycles Magazine. He has developed the Foundation’s award winning cycle analysis software, Techsignal.
He wrote for 10 years’ articles for Cycles Magazine which is available in all major libraries. His articles can easily be found online. From 1997 to 2003, he was Managing Director and Director of Research at Iris Financial Group, a hedge fund in Portland, Or.
In 2005, he returned to the Foundation for the Study of Cycles as Chief Voluntary Officer. Richard also served as, Director of Research and Chief Economist from 2005 -2010. From 2010 to 2012, he directed several trading projects at Weiss Research, in Jupiter Florida.
From 2004 to 2015 he was Head of research at CMF Investment Advisors, LLC.
He currently is Head of Research at Vorsus Capital, LLC. From 1995 to present he has developed proprietary stock and futures trading tools and software.
He has lectured at the University of Virginia and Temple University’s Business Schools on economics and the business cycle. He has spoken widely and has presented papers at economic conferences world wide including the Russian Academy of Sciences. He is an experienced computer programmer with an extensive background in statistics.
Richard has a BA in Philosophy and Classics, Magna cum Laude, from the University of California at Irvine.
Comments
5 Responses to “MAGICAL 7 – Cycle Declines in 7th Year of Decade”
Leave a Reply


October 4th, 2017 @ 1:01 pm
Thank you. This analysis is from an empirical stand point of view, as is the wave theory. From a scientific stand point, how is this explained? Why it happens?
What economic, business or demographics forces create the decennial cycles?
October 4th, 2017 @ 3:48 pm
Dear Blackpet, Economic, business or demographic forces are controlled by people, by civilisation, growing, expanding, decaying, contracting – in ‘Tides in the Affairs of Men’ by Edgar Lawrence Smith (1939), the discoverer of many seasonal rhythms and the decennial cycle, states ‘…if we are led to believe, natural phenomena have some part in determining the pattern of their recurrence’. But what is he referring to? – natural phenomena? R.N. Elliott came closer in stating in ‘Nature’s Law – the Secret of the Universe’ (1946) that markets had rhythms that unfold to the vibration of the Fibonacci sequence, action/reaction etc. – but if you really want to understand what drives mankind and the markets to unfold in this way, you have to take a leap of faith and read philosophical texts/books related to planetary cycles – W.D. Gann etc. – ‘all energy is expressed in wave cycles’ – Walter Russell – but modern Science is not quite yet ready to embrace these attributes. – P.G. by WaveTrack International
October 8th, 2017 @ 7:25 pm
Thank you very much for your reply.
Well I follow Elliott wave theory, fibo numbers and cycles. Fibo numbers do have an explanation based on the waves they occur, ie a lot of pessimisim in first wave out of a completed 5 bear impulse wave drives the 2nd wave correction to a deep 61,8 fibo number, whilst the optimism of the 3rd wave supports a shallow 4th wave correction most often to 38,2 fibo albeit the alteration rule between 2nd and 4th wave.
Gann… hard to understand his special angles numbers and so many others methods he used. Sure one of them will apply anyway in some cases, but can this be used for a secure forecast; I refer to square of nines, 45, 90 … 270, 360 degrees angles of support and resistance, etc.
. in the Tunnel through the Air I think he made some bad forecasts about what it follows after www ii. Many believe he was a manipulator, a freemason as well , and he impovised these forecasts methods to cover his market manipulations!
Cycles in commodities do occur since they have an explanation through economics laws. They have to do with supply and demand and farmers changing production in and out of a commodotity.
Stock market Cycles: If so we should expect a swift correction mid to late October, since both the 5, 10 and 20 year cycle suppport this alongside the decenial pattern plus a very deep market fall during summer 2018, before hitting an all times high 2019/2020.
Still all of these are just empirical statistical observations. Thus many Elliotticians change forecasts very often, with exception of Prechter who is perma bear the last 20 years or sells catastrophy in exchange of subscriptions! Others like Armstrong follow the pi cycle fibo pivots and computer models to forecast where the money flows. I believe that one should take into account a lot of parameters in the market and no one method of itself is capable to provide forecasts with increased probabilities of success. Follow the “smart money” usually wins.
Keep up the good work!
October 9th, 2017 @ 10:11 am
Dear blackpet,
Thank you for your keen observations.
If you are interested and for reference, the Society of
Technical Analyst’s journal, No.s 82 and 83 published this year includes Peter
Goodburn’s latest thought’s on the more scientific aspect of Elliott Wave,
Quantum Mechanics, Complexity & Chaos and Attractors in Dynamic
Systems –
STA Journal:
https://www.sta-uk.org/resources/sta-journal/
Very best wishes.
October 9th, 2017 @ 7:00 pm
Thank you for the reading tips!
Best Regards