Value Line Index – Expanding Flat!
by WaveTrack International| April 10, 2018 | No Comments
Markets Higher Now!
In recent updates, U.S. index declines from February 27th highs were identified as unfolding into 3-3-5, [A]-[B]-[C] expanding flat patterns. This is the case for the S&P 500, the S&P 400 mid-cap, the Russell 2000 small-cap, the Nasdaq 100 together with several sector indices including recent updates for the XLY Consumer Disc. Index. All indices ended the expanding flat patterns in or around the lows on April 2nd. Interestingly though, the Dow Jones (DJIA) unfolded during the same period into a different corrective pattern. A Zig Zag forming a 5-3-5 [A]-[B]-[C] pattern, the same as the major European indices. When two differing patterns like this synchronously unfold, it tells us a lot about their integrity, or validity. Moreover, it can tell us of what comes next.
Value Line Index
One index which also adhered to the expanding flat pattern between the dates of Feb. 27th to April 2nd was the Value Line index. Background (Wikipedia) – the total number of companies in the Value Line Composite Index hovers near 1675. The Value Line Arithmetic Composite Index was established on February 1, 1988. It is using the arithmetic mean to more closely mimic the change in the index if you held a portfolio of stocks in equal amounts. The Value Line index is a broader measure as it combines corporates from several exchanges, which has a tendency to smooth out distortions or exaggerated sequences.
Significance of the Expanding Flat Patterns
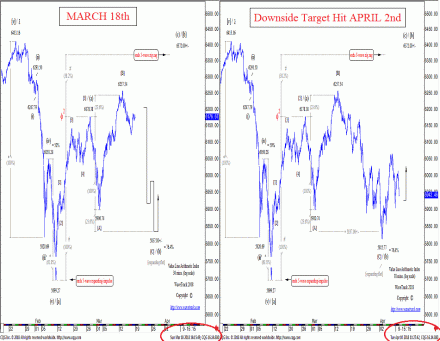
Note the expanding flat that began from the Feb. 27th high of 6178.38 (see fig #1, left) where wave [A] ended a double zig zag decline to 5900.74. Then a single zig zag upswing as wave [B] ending at 6257.54. And finally, wave [C] which at the time of this original update published on March 18th was trading at 6176.67 but forecast down towards the 5837.00+/- area.
As you can see, wave [C] declined into a tidy five wave impulse pattern, ending into the April 2nd low at 5815.77, just a little lower (see fig #1, right). The following advance into last week’s high at 6066.93 is too large to be part of the preceding expanding flat decline. It is undoubtedly confirming the completion of the expanding flat at those early-April lows. It is the beginning of the next upswing which at the moment, is targeting towards 6372.00+/- basis the original plan.
Conclusion
Stocks are still jittery as they trade around the volatile media news emanating from President Trump and his tariff plans. But there’s evidence in these Elliott Wave patterns that suggests we are seeing at least a short-term reprieve from the selling that occurred last month. Some positive gains are forecast during the next few weeks prior to the next breakdown.
Are you trading Nasdaq100, S&P 500, EuroStoxx, Russell 2000, Dow Jones 30, Dax, FTSE100, Shanghai Composite, Hang Seng or ASX200? Don’t miss WaveTrack’s regular updates in our bi-weekly EW-Compass Report! Ensure you’re tracking our Forex forecasts – subscribe online for the EW-COMPASS REPORT.
Visit us @ www.wavetrack.com and subsribe to our latest EW-COMPASS report!
Comments
Leave a Reply

