US$ Dollar Gains After Fed – Shouldn’t Crude Oil Also Decline?
by WaveTrack International| September 28, 2018 | No Comments
US$ Dollar Gains After Fed – Shouldn’t Crude Oil Also Decline?
Following Wednesday’s Federal Reserve interest rate hike of 0.25% to 2.25%, the US$ dollar has pulled higher by 1.23% per cent from 93.95 to 95.11. The US$ dollar looks set to continue higher over the next week or two as the finalising sequence of the expanding flat pattern (see Twitter post 26th September 2018).
Now what about Crude Oil?
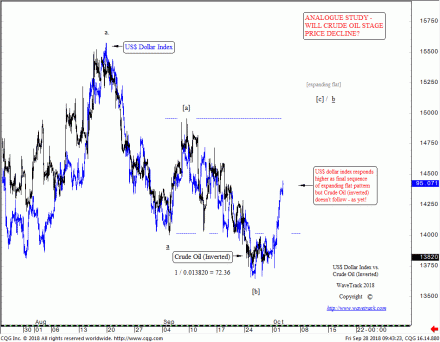
But the intriguing question now relates to Crude Oil – see fig #1.
As you can see from this analogue, there’s currently a high-negative correlation with the US$ dollar index. Even price-amplitudes are closely aligned. The US$ dollar index pulled higher through Wednesday/Thursday and continuing this advance today (Friday). However, Crude Oil has failed to respond lower in reaction to the stronger US$ dollar. Is there any obvious reason for this breakdown in the correlation?
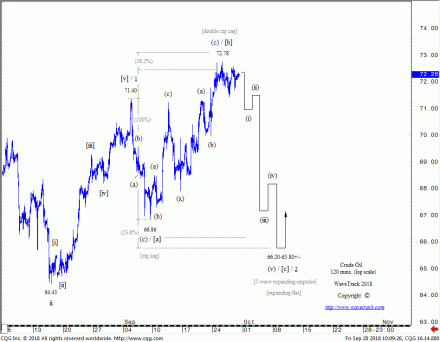
From an Elliott Wave perspective, the exact same Elliott Wave count is applied to Crude Oil, where an expanding flat is unfolding from Crude Oil’s early-September high of 71.40 – see fig #2. Labelled [a]-[b]-[c]. Wave [a] declined into a zig zag ending at 66.86 on September 7th. And was followed by a double zig zag upswing as wave [b] into the Sep. 25th high of 72.78. If correct, as we believe, then it really should decline now as wave [c] towards levels of 66.20-65.80+/-.
Conclusion
Perhaps it’s simply a case of playing ‘catch-up’. However, delays in these types of set-ups are not uncommon. One might view the delay as a complete breakdown of the negative correlation. In this case, Crude Oil’s underlying uptrend is so strong that it’s able to withstand a shorter-term US$ dollar rally. But often, trading opportunities exist where the divergence is simply delayed. Consequently, Crude Oil will perhaps suddenly, trade sharply lower.
Differentiation between the two possibilities comes down to the qualitative assessment of Crude Oil’s pattern. September’s advance does certainly conform to a double zig zag pattern (66.86-72.78). Therefore, the probability that it can still decline as wave [c] to 66.20-65.80+/- is increased.
Risk/Reward becomes a factor in whatever trade set-up is taken. Ensure close stops are applied, e.g. Crude Oil above the fib. 38.2% extension level of wave [a]’s trading-range at 73.15 would probably negate this high area as wave [b] of the expanding flat.
Bi-weekly updates on the US Dollar Index, Crude Oil, SP500, EuroStoxx, Nasdaq 100, Russell 2000, Dow Jones 30, Dax, ASX200 and more! Don’t miss WaveTrack’s regular updates in our bi-weekly EW-Compass Report! Ensure you’re tracking our Forex forecasts – subscribe online for the EW-COMPASS REPORT.
Visit us @ www.wavetrack.com and subsribe to our latest EW-COMPASS report!
Comments
Leave a Reply


