Stock Indices Mid-Year Video Update
by WaveTrack International| June 24, 2021 | No Comments
Stock Indices Video | PART I/III
STOCK INDICES – ‘INFLATION-POP’ Goes Mainstream! Post-Pandemic Advance Set to Take a Pause within Final Stage of Secular-Bull Uptrend – Risk of -30-40% Correction in Benchmark Indices during next 6-Months – Inflationary Pressures Ease but Not Over – European Indices set for Significant Correction – EuroStoxx Banks Take a Hit – Small-Cap’s Suffer – Technology/FANGS+ Decline but Outperforming with Biotechnology – EM’s Correct as US$ Dollar Revives
Includes Updated SENTIMENT & ECONOMIC INDICATOR STUDIES
We’re pleased to announce the publication of WaveTrack’s Mid-Year 2021 video updates of medium-term ELLIOTT WAVE price-forecasts. Today’s release is PART I, STOCK INDEX VIDEO – Parts II & III will be published during July/August.
• PART I – STOCK INDICES
• PART II – COMMODITIES
• PART III – CURRENCIES & INTEREST RATES
Elliott Wave Stock Indices Forecast – Highlights
Stock Indices – Shorter-term U.S.
Upside rallies in the S&P 500, Dow, Russell 2000 and Nasdaq 100 indices from the post-pandemic March ’20 lows as intermediate wave (5) have so far unfolded into three wave a-b-c zig zag patterns. Risk of completing 1st waves within ending-type diagonals with 2nd wave corrections between -30% to max. -40% per cent over next 6-month period. Alternate bullish counts otherwise depict short-term correction of -10% per cent followed by higher-highs.
Stock Indices – Shorter-term Europe
The post-pandemic advance of March ’20 began a secondary A-B-C zig zag advance within the double pattern in upward progress from the financial-crisis lows of 2008-09. Wave A ended an initial advance into the July ’20 high – wave B is unfolding into an expanding flat with the high reached now. Final downswing beginning from current levels. Risk of -30% per cent decline over next 6-month period.
Stock Indices – Emerging Markets
MCSI Emerging Market index has traded higher from post-pandemic lows of March ’20 into an a-b-c zig zag. This is consistent within its 3rd wave double zig zag advance of the ending-type diagonal that began its uptrend in early-2016. An x wave correction is forecast lower by -30% per cent over next 6-month period.
Stock Indices – Global/Asia
Hang Seng is same pattern as MSCI EM index, trending higher as and ending-type diagonal but downside risks of correction during next several months. The Shanghai Composite underperforming but expected to outperform next year in 2022 once shorter-term correction has completed during next several months. Bovespa trending higher from post-pandemic lows as developing a-b-c zig zag. Corrective declines over next several months. Russia’s RTS vulnerable to a corrective dip but could outperform into year-end although dominant trend to the upside. India’s Sensex/Nifty 50 at risk of -30% to max. -40% per cent correction within post-pandemic uptrend. Singapore’s Straits Times underperforming but like China, expected to catch up next year. Taiwan SE index set for sizable correction within dominant uptrend. Australia’s All-Ord/ASX 200 set for a multi-month correction around -30% per cent before resuming to record highs afterwards. Nikkei 225 forecast lower over next several months by -35% per cent prior to resuming ending-type diagonal in advance from March ’20 lows.
Stock Indices Elliott Wave Forecast Review – H1 2021
The Annual 2021 report published last December (2020) forecast the continuing uptrend for global indices from the post-pandemic lows of March ’20. This was the final stage of the secular-bull uptrend that began from the financial-crisis lows of 2008-09.
Benchmark indices like the S&P 500 began 5th waves from the coronavirus lows with December’s report showing upside progress as a five wave expanding-impulse pattern. Shorter-term corrections were forecast as sentiment indicators reached levels of ‘extreme optimism’ but that never happened . Indices had already staged minor correction in September and were in the process of continuing more immediately higher. However, they never looked back and are still trading right now, at post-pandemic highs.
Sentiment Remains High
There’s been quite a few records broken in the process. Bank of America reports that the March ’20 recovery is the 3rd largest percentage rally on record – the other two were following major lows at the time of the Great Depression of 1932, in 1933 and 1936.
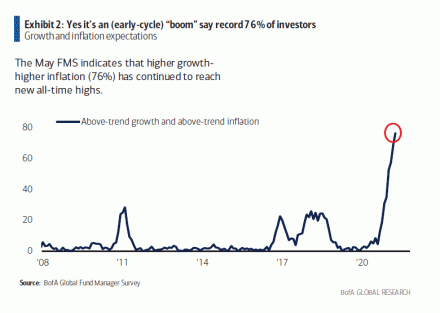
Their latest June ’21 Global Fund Manager Survey shows 76% per cent of investors believe the economy and the stock market is in an early-cycle ‘boom’ – see Fig #1. This reading is off-the-scale. By comparison, in previous peaks from the financial-crisis lows, readings were highest at 26-32% per cent. And even at the tops in early-2018!
Furthermore, that optimism is a straight-line advance from the post-pandemic low. However, it only went ‘exponential’ late last year when the northern-hemisphere summer holiday season ended. This is suggesting fund managers reassesses previous bearish call, turning very bullish from that time to present day.
The same survey reports net 75% per cent of fund managers expect a stronger economy which is just off a peak the previous month of 84% per cent. This high matches equivalent peaks in 1995, 2001, 2010 and 2014.
Now that’s really interesting!
Also, 68% per cent of fund managers don’t expect a recession until 2024 at the earliest – only 2% per cent expect a bear market in the next 6-months. Now that’s really interesting! The largest percentage of 47% believe a correction could unfold of less than <10% per cent and 6% per cent <20% per cent. That’s very skewed in optimism/complacency but only time will tell if this is a contrarian bear signal.
Elliott Wave Perspective
Certainly, from our Elliott Wave analysis, there’s a very high risk that markets will correct by more than the normal criteria of a -20% per cent for a ‘bear market’ but will instead decline between -30% to -40% per cent, depending on the index. If you want to understand the full story behind WaveTrack’s reasoning and analyis we invite you to watch our latest Stock Indices Video Part I/III.
New Stock Index Mid-Year 2021 Video – PART I/III
This MID-YEAR 2021 VIDEO UPDATE for STOCK INDICES is like nothing you’ve seen anywhere else in the world – it’s unique to WaveTrack International, how we foresee trends developing through the lens of Elliott Wave Principle (EWP) and how its forecasts correlate with Cycles, Sentiment extremes and Economic data trends.
We invite you to take this next step in our financial journey with us – video subscription details are below – just follow the links and we’ll see you soon!
Most sincerely,
Peter Goodburn
Founder and Chief Elliott Wave Analyst
WaveTrack International
Contents Stock Index Video Outlook 2021
Charts: 83 | Video: 2 hours 19 mins.
CONTACT US NOW VIA EMAIL – SELECT YOUR PACKAGE
Single Video – *$48.00 – PART I Stock Index Video Outlook 2021 (June ’21) or send us an email to services@wavetrack.com
Triple Package offer – *$96.00 (saving 33%)! – PART I – PART II – PART III (June – August ’21)
*(additional VAT may be added depending on your country – currently US, Canada, Asia have no added VAT but most European countries do)
PARTS II & III will be available in a few weeks’ time – we’re working on it!
HOW CAN YOU RECEIVE THE VIDEO FORECAST?
To receive your VIDEO UPDATE please click here to contact us.
– Please state if you wish to purchase the SINGLE VIDEO – Stock Index Mid-Year Video 2021 for USD *48.00 and send us an email to services@wavetrack.com?
– Or opt for the TRIPLE PACKAGE for USD *96.00 in total?
– Next we will send you a PayPal payment request and provide you with the video link & PDF report once payment is confirmed. Please know the reply can take up to 6 hours. But rest assured we will give our best to provide you with the information as soon as possible!
*(additional VAT may be added depending on your country of residence. Currently, the US, Canada, Asia have no added VAT but most European countries do)
We’re sure you’ll reap the benefits – don’t forget to contact us with any Elliott Wave questions – Peter is always keen to hear your views, queries, and comments.
Visit us @ www.wavetrack.com
Comments
Leave a Reply


