Stock Index Video Outlook – 2021 | PART I/III
by WaveTrack International| December 28, 2020 | 1 Comment
STOCK INDEX VIDEO OUTLOOK –
‘FINAL STAGE of the SECULAR-BULL UPTREND’
This report combines ELLIOTT WAVE with updated SENTIMENT & ECONOMIC INDICATOR STUDIES
We’re pleased to announce the publication of WaveTrack’s Annual 2021 video updates of medium-term ELLIOTT WAVE price-forecasts. Today’s release is PART I, STOCK INDEX VIDEO – Parts II & III will be published during January/February.
• PART I – STOCK INDICES
• PART II – COMMODITIES
• PART III – CURRENCIES & INTEREST RATES
Elliott Wave Stock Index Forecasts for 2021 – Summary
Fiscal & Monetary Stimulus Rescue
In last June’s mid-year report, COVID-19 Aftermath II – Secular-Bull Market Uptrend Resumes! we discussed how stock markets had collapsed, then staged a massive ‘V’-Shaped recovery. Whilst economists were still scratching their heads about the dislocation between the economic fall-out of a COVID-19 pandemic and exponential rises in stock markets, insiders were buying the markets basis one simple fact – central banks and governments around the world were embarking upon a historic, unprecedented path of fiscal and monetary stimulus as never seen before . And that means prices must rise! – and they did!
Global Fund Manager Survey
It was months later that Bank of America/Merrill Lynch’s Global Fund Manager Survey showed a sudden improvement in sentiment. Up until then, fund managers were still debating whether a recovery had begun at all! The majority said the rally was a brief one, with COVID-19 being the drag going forward. It wasn’t until after the northern-hemisphere annual summer holidays ended in mid-September that the realisation of a more sustained economic recovery began to filter into the mindset. By that time, the benchmark S&P 500 was higher by +64% per cent. Since then, a downswing followed by an upswing has taken the S&P 500 to a new record high. But even at today’s levels of 3733.00, that’s only +4% per cent gain since early-September. And yet more funds have been allocated into the markets over the last few months than at any other time since March.
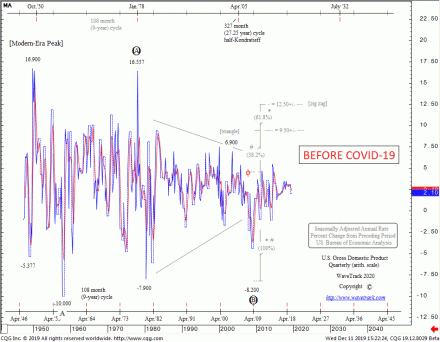
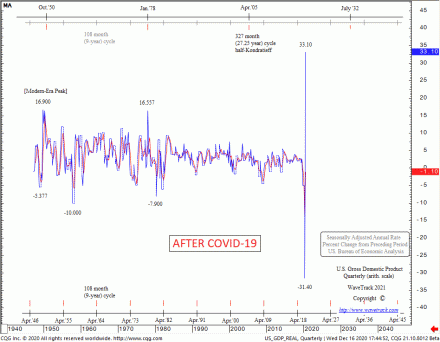
From an Elliott Wave perspective, you’d think that such an event as the COVID-19 pandemic would be a trigger for a secular bear market to begin. It’s certainly reverberated through many different economic statistics. A good example is the gyrational swings in the U.S. GDP (Gross Domestic Product) figures – see fig’s #1 & #2. Before COVID-19, annual GDP growth was around 2.10% per cent. And when the coronavirus struck and governments went into lock down mode, GDP collapsed to a low of minus -31.4% per cent, only to rebound later to +33.1% in the Q3 reporting. As you can see, these two swings are unprecedented. Even as far back as the 1940’s when the historical data began – crazy!
Fiscal and Monetary Stimulus
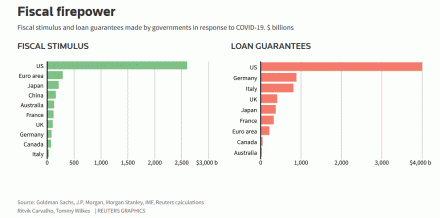
More impressive is the way central banks and governments have stepped in with an estimated $19.5 trillion dollars of fiscal and monetary stimulus in an attempt to shield their economies from the coronavirus pandemic. Record sums that take balance sheets and deficits to peacetime record highs. The sum equates to about 17% of an $87 trillion global economy. Leading the top-10 list is the United States with over $2.5 trillion pledged – see fig #3. Europe has since announced a new €1.5 trillion Euro-denominated package although spanning the next several years.
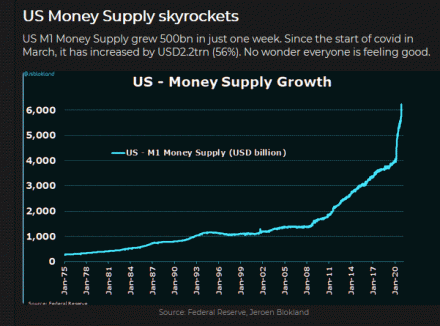
U.S. M1 money supply has risen exponentially since March, growing by $2.2trn – see fig #4. As Elliott Wave analysts, whenever we see exponential rises like this, it almost always confirms the final sequence within a longer-term uptrend. Just like this one that began from the lowly-lows of the 1970’s. The trick is predicting how far and for how long it continues to rise before forming a major peak, then declining just as quickly in the subsequent years to form that all-so-familiar parabolic bell-shaped curve.
I think we have a pretty good idea of what conditions will end the current asset price rise and an indication of when that peak occurs.
Dow Jones On-Course for Long-Term 40,000-42,000 Upside Targets
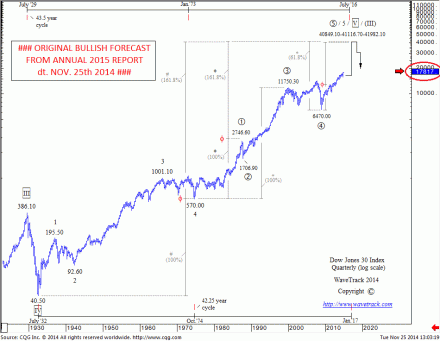
Back in November/December 2014, six years ago, the Dow was trading at 17817.00, approaching original upside targets forecast back in 2010. But this secular-bull peak wasn’t aligned to the completion of corresponding ‘Inflation-Pop’ upside targets for Emerging Market indices and key Commodities like Copper and Crude Oil.
This was a big hint that the secular-bull uptrend in the Dow Jones (DJIA) and other developed market indices were far from complete. Further analysis revealed some amazing Fibonacci-Price-Ratio (FPR) ‘proportion’ values across the entire history of its major five wave impulse uptrend dating back to the Great Depression lows of 1932 – see fig #5. They coalesced towards Dow 40,000-42,000!
The secular-bull uptrend was labelled unfolding into a cycle degree pattern, 1-2-3-4-5. Extending waves 1-4 by a fib. 161.8% ratio projected ultimate upside targets for wave 5 towards 41116.70+/-,
1 (40.50) – 4 (570.00) x 161.8% = 5 @ 41116.70
Furthermore, subdividing cycle wave 5 into primary degree, 1-2-3-4-5, a fib-price-ratio convergence forms at 41982.10+/- where primary wave 5 unfolds by a fib. 61.8% correlative ratio of waves 1-3,
1 (570.00) – 3 (11750.30) x 61.8% = 5 @ 41982.10
Subdividing primary wave 5 into intermediate degree, (1)-(2)-(3)-(4)-(5) also provides ultimate upside targets for wave (5) towards 39207.00+/- derived by extending wave (1) by a fib. 161.8% ratio,
(1) [6470.00-12391.30] x 161.8% = (5) @ 39207.00
These three upside targets average out at 40768.60+/-
And so, proportionally, symmetrically and harmonically, Dow 40-42k remains to this day, a very realistic probability of being reached before the secular-bull uptrend is completed.
Timing the ‘Inflation-Pop’ Peak
Cycle analysis has since shown a 94-year cycle peak due in late-2023/early-2024 that has our attention in providing the timing for the ‘Inflation-Pop’ bubble-burst. See June’s report or this new, updated PART I STOCK INDICES annual report/video.
US$ Dollar Outlook
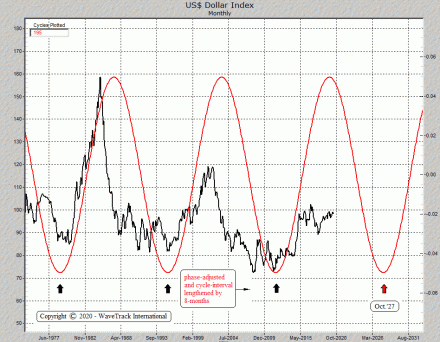
One contributor that’s expected to drive asset values significantly higher over the few years is a weakening US$ dollar – see fig #6.
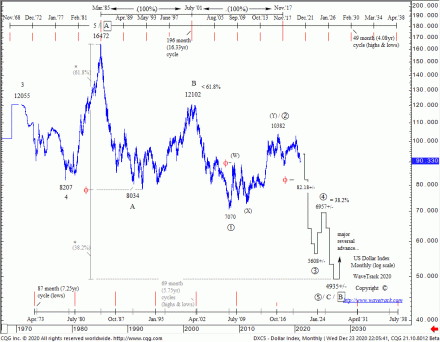
There’s a distinct 15.6-year cycle recurrence for the US$ dollar index which has signalled the various peaks and troughs over the past several decades. However, in our original cycle analysis, the 15.6-year model showed the dollar’s decline into its next ‘trough’ due in 2023/24. But we wonder if there’s enough time for a -45% decline basis our Elliott Wave analysis where cycle wave C declines bottom around 49.35+/– see fig #7?
It’s possible to lengthen the cycle interval to 16.25 years, which connects the cycle-troughs together in a more synchronous rhythm. That would stretch the next cycle-trough into Oct.’27. That would allow more time for the dollar’s decline to test 49.35+/-. It might also lengthen the stock market secular-bull uptrend too?
Shorter-Term – Risk-Off During Q1 ‘21
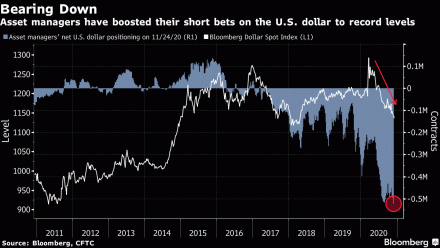
Shorter-term analysis suggests the post-COVID-19 risk-on advances in global stock markets and commodities is about to take a rest. One hint comes from the oversold condition in the US$ dollar – see fig #8. In this chart from Bloomberg, asset managers are shown with huge net-short positioning, at record levels. That will almost certainly trigger a relief rally in the dollar soon, indicating the stock market will undergo a severe correction during Q1 2021, contrary to consensus opinion.
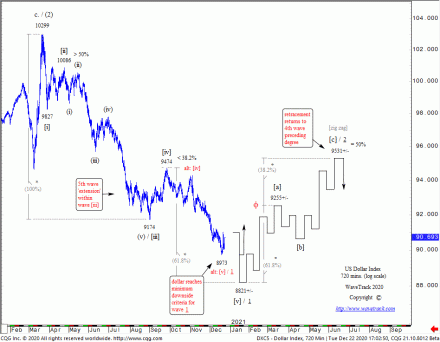
The US$ dollar index is approaching the downside completion of a five wave impulse pattern from March’s COVID-19 peak of 102.99 where downside targets already being tested at 89.73 but potentially extending to 88.21+/- prior to a sustained counter-trend, multi-month advance – see fig #9. This would suggest a period of risk-off during Q1 ’21.
Stock Index and Sentiment
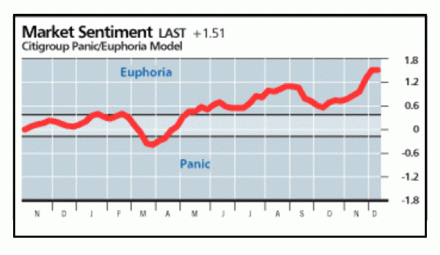
Citigroup’s Market Sentiment index is confirming the same risk-off period is about to begin across New Year – see fig #10. It advanced to a fresh record high at 1.65 vs 1.61 last week and 1.10 in the week prior. Anything above .40 is considered euphoric and from a contrarian perspective, is screaming out for a stock market correction.
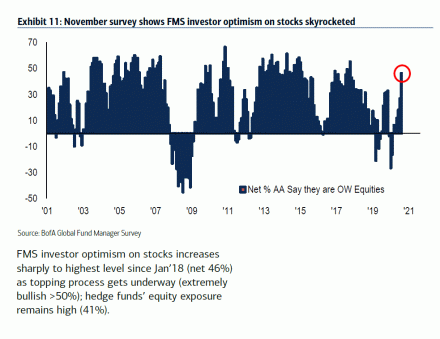
Earlier last month, Bank of America/Merrill Lynch’s GFM survey showed investor optimism had sky-rocketed over the past months, since September, where levels are at 46% per cent whilst hedge funds’ equity exposure remains high at 41% per cent – see fig #11.
S&P 500 – Short-Term Correction Q1 ‘21
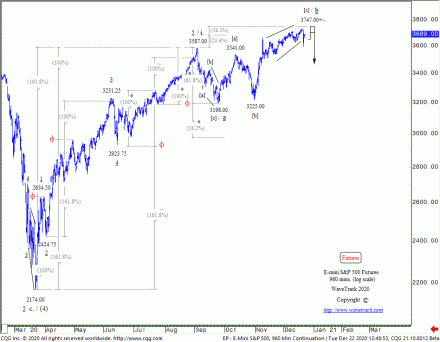
The S&P 500’s advance from the March COVID-19 low of 2174.00 has unfolded into a five wave impulse pattern, labelled minor wave i. one within intermediate wave (5)’s ongoing uptrend. Subdividing into minute degree, 1-2-3-4-5, wave 5 completed into the early-September high of 3587.00. This was slightly higher than upside targets of 3511.00+/- and just below 3595.00+/- derived by extending wave 1 by a fib. 161.8% ratio – see fig #12.
Minor wave ii. two’s correction is already underway, unfolding into a three wave a-b-c expanding flat pattern. This allows a modest higher-high in the second sequence prior to a third wave decline. This explains why the S&P has since traded up to 3733.00. Applying Elliott’s guideline that corrections fall back towards ‘fourth wave preceding degree’, minimum downside targets are towards the area of minute wave 4’s low of 2923.75. That translates into a heft decline of around -20% per cent during Q1 ’21, very much against the consensus view.
European Indices / Emerging Markets + Asia – Australia – Japan
An important aspect related to the next surge higher is the Elliott Wave pattern development of European and Asian indices. These have very different patterns in upside progress from the financial-crisis lows of 2008/09. But they do conform to the ‘Inflation-Pop’ schematic of zig zags or double zig zag advances over multiple decade periods.
If you’re an asset manager located in Europe or Asia, it’s imperative to understand how these benchmark indices fit into the larger U.S. picture! This latest annual 2021 report takes an in-depth look at the price-projections for the MSCI EM index plus many more EM and ASIAN indices.
Annual 2021 Outlook – Report/Video
Our annual 2021 Stock Index report/video is PART I of a three-part trilogy series of Elliott Wave analysis and the outlook into the final stages of the secular-bull ‘Inflation-Pop’ cycle.
We’ll be taking a close introspective look across many U.S. indices, the large-cap and small-cap trends, but also across many different sectors too including the FANGS+ index, U.S./European Banks, Biotechnology, Technology and many more – we’re also updating some fascinating Elliott Wave counts for several economic data points too, including Consumer Sentiment, Consumer Confidence, Price to Book Ratio, Price-Sales Ratio! It all adds-up to one thing – huge gains over the next few years!
New Stock Index 2021 Video – PART I/III
This ANNUAL 2021 VIDEO UPDATE for STOCK INDICES is like nothing you’ve seen anywhere else in the world – it’s unique to WaveTrack International, how we foresee trends developing through the lens of Elliott Wave Principle (EWP) and how its forecasts correlate with Cycles, Sentiment extremes and Economic data trends.
We invite you to take this next step in our financial journey with us – video subscription details are below – just follow the links and we’ll see you soon!
Most sincerely,
Peter Goodburn
Founder and Chief Elliott Wave Analyst
WaveTrack International
Contents Stock Index Video Outlook 2021
Charts: 84 | Video: 1 hour 59 mins.
CONTACT US NOW VIA EMAIL – SELECT YOUR PACKAGE
Single Video – *$48.00 – PART I Stock Index Video Outlook 2021 (December ’20) or send us an email to services@wavetrack.com
Triple Package offer – *$96.00 (saving 33%)! – PART I – PART II – PART III (January – March ’21)
*(additional VAT may be added depending on your country – currently US, Canada, Asia have no added VAT but most European countries do)
PARTS II & III will be available in a few weeks’ time – we’re working on it!
HOW CAN YOU RECEIVE THE VIDEO FORECAST?
To receive your VIDEO UPDATE please click here to contact us.
– Please state if you wish to purchase the SINGLE VIDEO – Stock Index Video Outlook 2021 for USD *48.00 and send us an email to services@wavetrack.com?
– Or opt for the TRIPLE PACKAGE for USD *96.00 in total?
– Next we will send you a PayPal payment request and provide you with the video link & PDF report once payment is confirmed. Please know the reply can take up to 6 hours. But rest assured we will give our best to provide you with the information as soon as possible!
*(additional VAT may be added depending on your country of residence. Currently, the US, Canada, Asia have no added VAT but most European countries do)
We’re sure you’ll reap the benefits – don’t forget to contact us with any Elliott Wave questions – Peter is always keen to hear your views, queries, and comments.
Visit us @ www.wavetrack.com
Comments
One Response to “Stock Index Video Outlook – 2021 | PART I/III”
Leave a Reply

May 30th, 2024 @ 6:59 pm
Great post! We will be linking to this great content on our website. Keep up the great writing.