How to determine the next move for the SP500?
by WaveTrack International| November 21, 2017 | No Comments
SP500 and Elliott Wave!
The SP500 has been making hard work of maintaining its uptrend since the last significant correction occurred into last August’s low of 2415.75 (futures). Since then, a five wave impulse pattern has pushed markets up by +7.3% per cent, impressive, but the momentum is now waning.
The impulse pattern began by unfolding into a series of 1-2’s, a step-like sequence of advances and declines of similar amplitude which are simply the fractal subdivisions of the up-coming 3rd wave. After three 1-2 sequences, ‘price-expansion’ occurred from the late-September low of 2485.00 which acts as the 3rd-of-3rd-of-3rd wave sequence within the pattern.
The reason why the S&P is now making hard work of maintaining the same velocity is because, since early-October, it is engaged in a corresponding series of 4-5’s which are approaching upside completion that ends the entire impulse from August’s low.
The Double Diagonal!
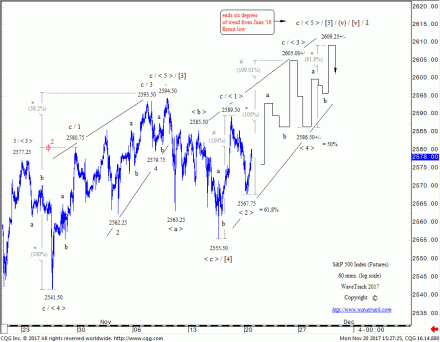
If we zoom-in to the final stage of the 4-5-4-5 sequences, we can see something a little unusual – see fig #1. The last two impulse advances as 5th waves can be seen taking the form of an ending/contracting diagonal pattern. The first of the diagonals acts as the fifth wave within the larger 3rd within August’s impulse advance. Note that extending wave 1 to 2580.75 projects the peak of wave 5 in close proximity to the final high of 2594.50.
This was followed by a three wave correction to 2555.50, ending the larger 4th wave within August’s impulse advance.
The following advance has also the initial hallmarks of unfolding into a diagonal too. The push higher from 2555.50 to 2589.50 has definitively unfolded into a three wave sequence, not a five. Had it been a five, this would have resulted in the advance proceeding as an ‘expanding-impulse’, but as a three wave sequence, this fits the profile of an ending/diagonal, because the impulse sequences, i.e. 1-3-5 are expected to subdivide into zig zags (or multiples, doubles/triples).
The 2589.50 high is labelled as ending the first wave, wave < 1 > within the ending/diagonal, wave < 2 > has since pulled lower to 2567.75. But wave < 3 > is now engaged to the upside – this must also subdivide into a zig zag (as illustrated) or perhaps a double/triple sequence.
The Fibonacci Advantage
Wave < 3 > is commonly slightly larger than wave < 1 >, so we’ve used a subliminal fib. 109.01% ratio that measures its high towards 2605.00+/-. Wave < 4 > then pulls back towards the fib. 50% retracement area at 2586.50+/- which is enough to cause the necessary ‘overlap’ of wave < 1 >. And finally, wave < 5 > to upside targets towards 2609.25+/- where this unfolds by a fib. 61.8% ratio of wave < 3 >.
Observing back-to-back diagonals is something interesting to watch – this doesn’t happen often, and predicting a second is somewhat speculative but definitely worth exploring.
Are you trading the SP500? Don’t miss WaveTrack regular updates in our bi-weekly EW-Compass Report! Ensure you’re tracking our forecasts – subscribe online for the EW-COMPASS REPORT.
Visit us @ www.wavetrack.com and subsribe to our latest EW-COMPASS report!
Comments
Leave a Reply

