S&P 500 – shows weakness
by m.tamosauskas| April 19, 2013 | No Comments
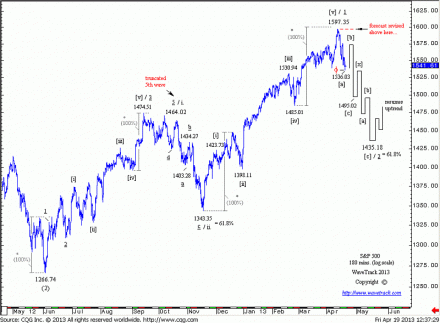
The S&P sold off sharply from its 1597.35 and is now in the process of confirming a reversal signature. The initial decline to 1536.03 unfolded into a five wave sequence – now, a counter-trend three wave upswing is expected prior to downside continuation. Interestingly, the 1536.03 low is very close to a golden ratio cut basis the original interim objectives at 1495.02. This suggests that the pattern labelled as minute wave 2 is going to unfold into a double zig zag sequence instead of a single type with the first zig zag projected to complete at 1495.02 and the secondary at ultimate targets to 1435.18, the fib. 61.8% retracement of the preceding 1343.32-1597.35 advance. A break above 1597.35 would revise this forecast – see fig. #2.
(Become an EW-Compass report subscriber and see how this pattern continues to develop and what’s coming up in the larger time-series).
Comments
Leave a Reply

