S&P 500
by m.tamosauskas| November 30, 2012 | No Comments
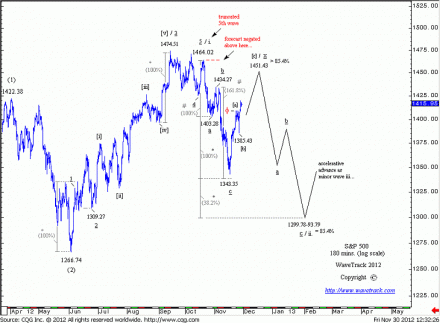
The counter-trend sequence as minor wave ii. two in progress from the mid-October high of 1464.02 is shown unfolding into a double zig zag sequence of minute degree, a-b-c-x-a-b-c. The first zig zag completed at 1343.35 and is now being followed by wave x counter-trend rallies with idealised upside to 1451.43. A reversal signature from there would trigger the secondary zig zag that is projected to ultimate downside at 1299.78 by a fib. 38.2% extension of the first zig zag. This level roughly converges with the fib. 85.4% retracement of minor wave i. one. At this point of time, we still cannot eliminate the possibility of the S&P ending its decline below the June ’12 low of 1266.74. This is because the June-September upswing is actually a mess, a seven price-swing advance to the actual high of 1474.51 and a nine (5 wave impulse with extension) to the ‘truncation’ to 1464.02. If this advance ended a seven wave double zig zag sequence to 1474.51, then the following decline would become the final sequence of a larger expanding flat pattern for intermediate wave (2) with downside targets to 1232.57-26.50
(Become an EW-Compass report subscriber and see how this pattern continues to develop and what’s coming up in the larger time-series).
Comments
Leave a Reply

