S&P 500
by m.tamosauskas| September 12, 2012 | No Comments
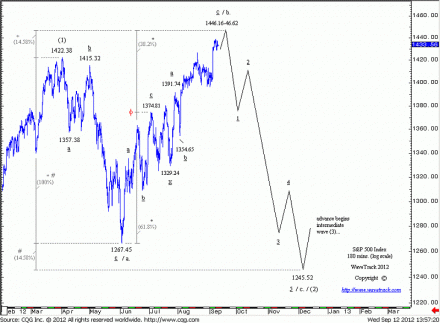
The S&P is at a critical juncture as original upside targets to 1446.16-46.62 are being approached. Any reversal from here would confirm the end of the entire upswing from the June low of 1267.45 and begin an expanding-impulse decline over the next months finalising a larger 3-3-5 pattern that began from the April ’12 high of 1422.38.
Seen from a slightly larger perspective, the S&P is seen engaged in a counter-trend correction that began from the April ’12 high of 1422.38, taking the shape of an expanding flat pattern. This sequence, labelled as intermediate wave (2), is subdividing into minor degree, a-b-c, where wave a. declines to 1267.45 are followed by wave b. advances to 1446.16-46.62. These levels are measured by a fib. 14.58% extension of wave a. and a fib. 61.8% extension of the first zig zag within the double zig zag sequence that is shown to make up the structure for wave b. Once these upside objectives are achieved, await a reversal signature to confirm wave c. declines have begun. Ultimate downside targets for wave c. to be approached during the next months are projected to 1245.52 by a fib. 14.58% extension of wave a.
(Become an EW-Compass report subscriber and see how this pattern continues to develop and what’s coming up in the larger time-series).
Comments
Leave a Reply

