The power of correlation studies (Elliott Wave analysis)
by WaveTrack International| July 4, 2015 | No Comments
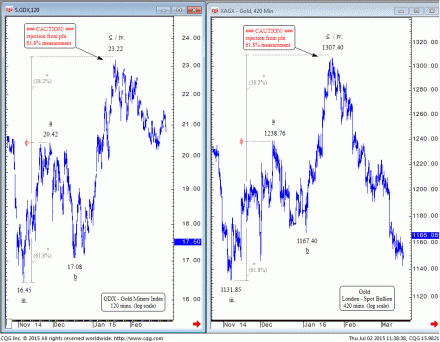
We place a lot of emphasis to comparison studies of correlated asset classes. Each has its own rhythm, vibration frequency and although the exercise is to pair off or group differing ones into positive or negative correlations, the real insights gained are from examining their subtle differences and finding out what their common denominators are in terms of pattern. In other words, discovering what Elliott Wave pattern sequence fits each individual contract whilst it simultaneously conforms to a common denominator of synchronised price development. This provides a unique perspective in the task of price-determination, price-prediction as it helps to eliminate certain possibilities through discrepancies whilst highlighting those with the greatest probabilities of coordination. We tend to use this method on a day-to-day, top-down basis to any Elliott Wave analysis that we publish. Let us visualize one of examples. In Jan.’15 gold broke above 1300.00 US$ dollars and it was suspected to finish it’s larger counter-trend advance near 1310.00+/- US$, measured by extending minute wave a by a fib. 61.8% ratio. The corresponding GDX – Gold Miners Index was also expected to complete its counter-trend single zig zag advance from the Nov.’14 low of 16.45 with upside objectives measured towards 23.25+/- derived by using the same fib-price-ratio methodology. A synchronized response and a reversal signature to the downside on both contracts gave us a clear signal – both are ready to resume their larger declines and they did.
Comments
Leave a Reply

