Eurostoxx 50
by m.tamosauskas| September 5, 2012 | No Comments
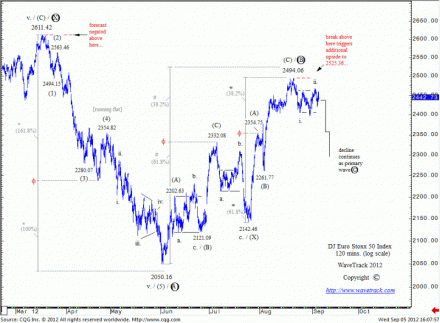
Declines from the Aug.’12 high of 2494.06 are resuming the larger downtrend that began from the Jan.’10 high of 3044.37. Shown on this chart is the final sequence of that downtrend in progress from this year’s high of 2611.42. Should the Eurostoxx manage to stay below 2494.06, declines are expected for the remainder of the year. A break above 2494.06 would trigger more upside to 2525.36, but only an advance above 2611.42 will negate this forecast.
(Become an EW-Compass report subscriber and see how this pattern continues to develop and what’s coming up in the larger time-series).
Crude oil
by m.tamosauskas| September 4, 2012 | No Comments
No immediate change.
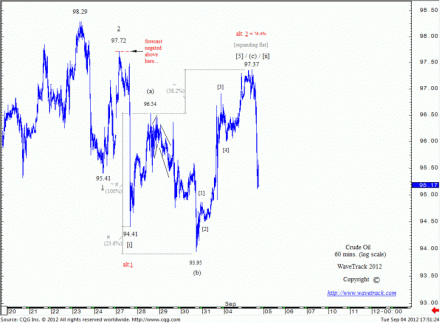
Price target for minuette wave [ii] has been achieved at 97.37.
(Become an EW-Compass report subscriber and see how this pattern continues to develop and what’s coming up in the larger time-series).
Crude oil
by m.tamosauskas| September 3, 2012 | 1 Comment
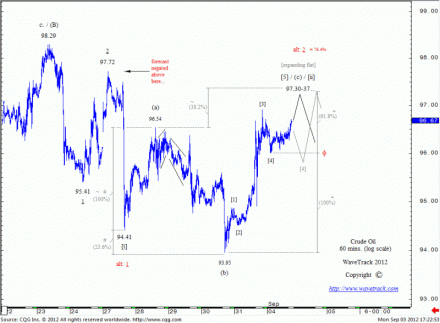
Last week’s advance broke above the 96.54 level transforming the counter-trend zig zag upswing from 94.41 into a more complex expanding flat pattern. This counter-trend rally remains as minuette wave [ii] but remains incomplete with revised upside targets towards 97.30-37. Price targets for minuette wave [ii] are measured this way: first, extending sub-minuette wave (a) of the expanding flat pattern by a fib. 38.2% ratio projects target towards 97.37 – second, extending the total distance of waves [1] to [4] of the impulse pattern unfolding as sub-minuette wave (c) by a fib. 61.8% ratio projects a target level towards 97.30. Such convergences are important inflexion points that signify potential reversal levels of the future. Elliott’s rule is that second wave retracements must not break beyond the starting point of the first wave, in this particular example, the high at 97.72 of minuette wave [i] – a break above this level will negate this bearish count allowing higher highs before a reversal to the downside.
(Become an EW-Compass report subscriber and see how this pattern continues to develop and what’s coming up in the larger time-series).
BUND
by m.tamosauskas| August 31, 2012 | No Comments
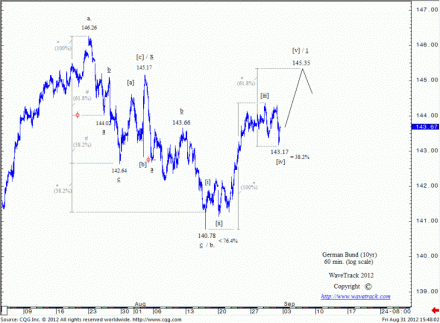
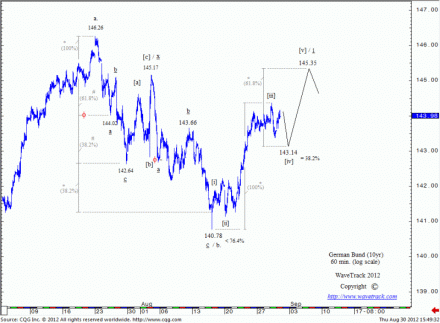
Quick post since markets are really volatile today. Germany’s 10 year Euro Bund future has reversed nicely from our original target (143.14), actually it missed only 0.03 points. Now everything is in place for a final upswing towards 145.35 to finish five wave expanding-impulse pattern.
(Become an EW-Compass report subscriber and see how this pattern continues to develop and what’s coming up in the larger time-series).
BUND
by m.tamosauskas| August 30, 2012 | No Comments
Germany’s 10 year Euro Bund future from the high of 146.26 to the low of 140.78 unfolded into a double zig zag pattern. It has reversed and now is unfolding into an expanding-impulse pattern, labelled [i]-[ii]-[iii]-[iv]-[v] in minuette degree. So far only three waves are visible which means the upswing that started from 140.78 is not complete. An ideal price target for minuette wave [v] is measured towards 145.35. Once again, we are looking for other asset classes to confirm our outlook for the stock market. Recently, the correlation between bunds and global stock indices is somewhat mixed but it should resolve sooner rather than later into the common negative correlation.
(Become an EW-Compass report subscriber and see how this pattern continues to develop and what’s coming up in the larger time-series).
Crude Oil
by m.tamosauskas| August 29, 2012 | No Comments
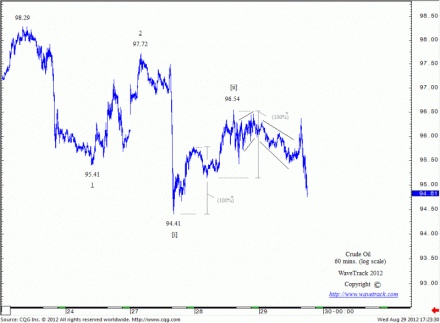
Crude oil short-term chart represents nice Elliott Wave patterns. Yesterday we mentioned that from the top of 98.29 crude oil depicts a step-like series of g 1’s and 2’s. It could be that another smaller 1 and just finished couple of minutes before. Today it maintains unfolding in the same manner. The only thing that is missing – is accelerative down-swing, which could start any time from now.
(Become an EW-Compass report subscriber and see how this pattern continues to develop and what’s coming up in the larger time-series).
Crude Oil
by m.tamosauskas| August 28, 2012 | No Comments
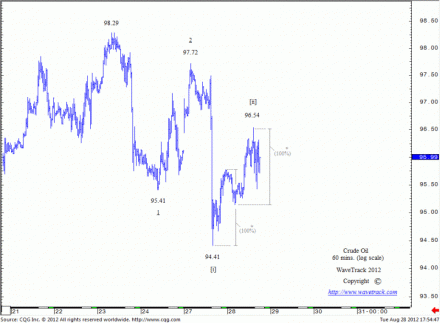
Crude oil unfolded into a three wave sequence from the recent low of 94.41. From an Elliott Wave perspective, the count from the top of 98.29 depicts a step-like series of 1’s and 2’s, with a third wave expansion due for crude oil at any time during the next few trading sessions.
Crude oil is positively correlated to global stock indices. If this commodity is expected to expand to the downside, this will translate into more pressure for the global stock indices.
(Become an EW-Compass report subscriber and see how this pattern continues to develop and what’s coming up in the larger time-series).
AUDUSD
by m.tamosauskas| August 27, 2012 | No Comments
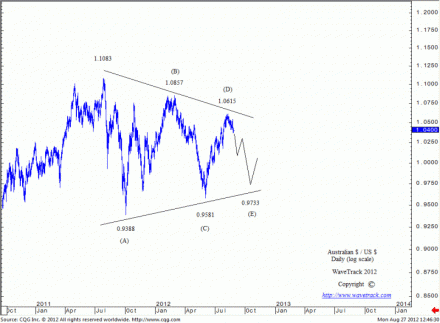
Australian $ / US $ started counter-trend decline from the July’11 high of 1.1083. It is taking the form of a triangle pattern with ultimate downside targets to 0.9733 that is scheduled to complete late 2012. A down-swing is unfolding into a triangle pattern, labeled (A)-(B)-(C)-(D)-(E) in intermediate degree. Each wave is retracing about fib. 85.4% of the preceding wave.
Intermediate wave (D) finalised at 1.0615 near 85.5% retracement level of the preceding intermediate wave (C). The final decline as wave (E) of the triangle is in early progress. It is expected it will unfold into a three wave zig zag sequence to a measured downside target of 0.9733 (fib. 85.4%). This currency pair is positively correlated to global stock indices, in that case we should expect some downward pressure for S&P 500, DAX 30 and others till intermediate wave (E) will finalise.
(Become an EW-Compass report subscriber and see how this pattern continues to develop and what’s coming up in the larger time-series).
BUND
by m.tamosauskas| August 23, 2012 | No Comments
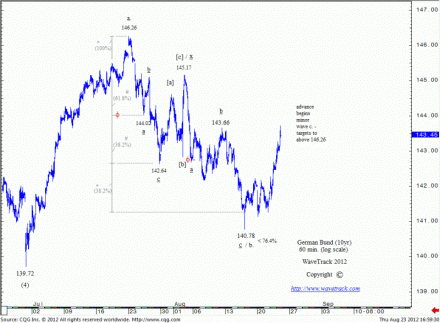
Germany’s 10 year Euro Bund future spiked above 143.66 that eliminates some bearish counts. The price action remains in bullish manner, which off course should result in bearish action for global stock indices. Combining together with other reversal signatures in different asset classes, this provides strong evidence that Germany’s 10 year Euro Bund future is expected to advance further towards 146.26, whilst global stock indices should accelerate in the opposite direction.
(Become an EW-Compass report subscriber and see how this pattern continues to develop and what’s coming up in the larger time-series).
DAX 30 – REVERSAL
by m.tamosauskas| August 22, 2012 | No Comments
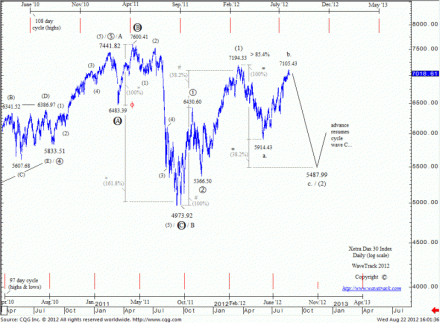
The advance from the low of November ’11 at 5366.50 to the March ’12 high of 7194.33 represents the completion of intermediate wave (1) and this is currently being balanced by a counter-trend retracement decline as intermediate wave (2) – it is still in progress. This decline is unfolding into a single zig zag pattern, labeled a.-b.-c. in minor degree. Minor wave a. unfolded into a five wave expanding-impulse pattern that was completed in June ’12 at 5914.43. Minor wave b. unfolded into a double zig zag pattern and yesterday has reached its lower upside targets towards 7102.40-28.81 with a high of 7105.43. The final down-swing as minor wave c. has begun with ultimate downside targets towards 5487.99. This is expected to complete before year-end 2012.
(Become an EW-Compass report subscriber and see how this pattern continues to develop and what’s coming up in the larger time-series).
