by m.tamosauskas| October 26, 2012 | No Comments
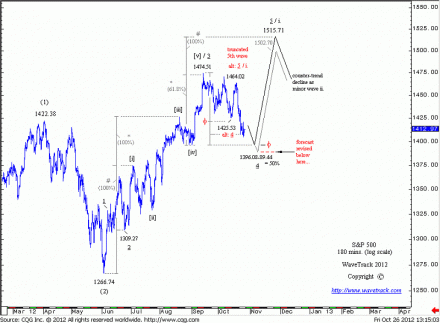
The decline from the September high of 1474.51 is still in progress, unfolding as a 4th wave within a larger ongoing five wave upswing from the June low of 1266.74. Shorter-term, downside targets measure to 1396.08 but could also extend to the fib. 50% support at 1389.44. As this is commonly the max. retracement for a 4th wave, <b>any acceleration below 1389.44 would revise this forecast. A reversal from the 1396.08-1389.44 area would otherwise trigger the finalising 5th wave advance in the weeks ahead, with original upside targets to 1502.70-15.71.
(Become an EW-Compass report subscriber and see how this pattern continues to develop and what’s coming up in the larger time-series).
Nasdaq Composite
by m.tamosauskas| October 18, 2012 | No Comments
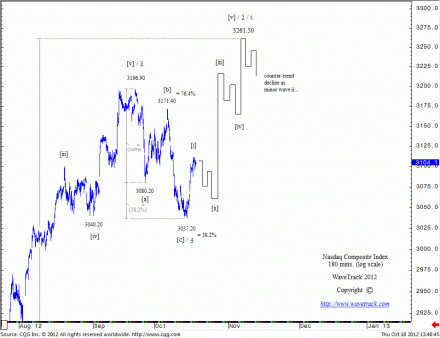
The focus on this chart is minute wave 4’s text-book counter-trend decline between 3196.90 to 3037.20. This was expected to unfold into a single zig zag pattern towards 3036.80 derived by extending minuette wave [a] a fib. 38.2% ratio. This ratio can be used when wave B of a zig zag pattern retraces 50% or more of the preceding wave A. The exact price level that completed zig zag pattern was 3037.20, just a 0.40 point shy of our original price level! Use ratio and proportion measurements to get more advanced analysis of Elliott Wave Theory.
(Become an EW-Compass report subscriber and see how this pattern continues to develop and what’s coming up in the larger time-series).
S&P 500
by m.tamosauskas| October 17, 2012 | No Comments
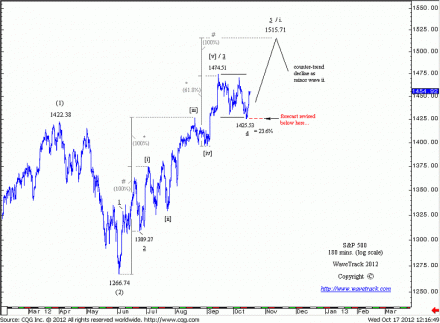
The reversal signature from last Friday’s low of 1425.53 has triggered the finalising upswing of the larger uptrend in progress from the June low of 1266.74. Ultimate upside is measured to 1515.71. Original lower upside to 1487.87 has been ruled out due to the substructure of the current advance from 1425.53 which implies more upside potential. Once 1515.71 has been achieved, await a reversal signature to confirm a counter-trend decline to the entire 1266.74-1515.71 advance has begun. This forecast is revised below 1425.53.
(Become an EW-Compass report subscriber and see how this pattern continues to develop and what’s coming up in the larger time-series).
Dow Jones 30
by m.tamosauskas| October 15, 2012 | No Comments
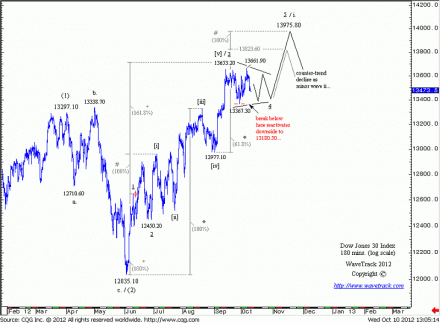
As the Dow Jones Industrial has already exceeded the preceding 13367.30 low, the contracting-symmetrical triangle pattern unfolding as minute wave 4 from the September high of 13653.20 has been changed into an expanding flat sequence. Short-term downside objectives measure to 13300.70 – a reversal from there would trigger the finalising upswing to min. 13823.60 and max. 13975.80 during the next weeks. Only an acceleration below 13259.70, the fib. 38.2% extension of wave ‘A’ of the flat, will revise this forecast.
(Become an EW-Compass report subscriber and see how this pattern continues to develop and what’s coming up in the larger time-series).
S&P 500
by m.tamosauskas| October 10, 2012 | No Comments
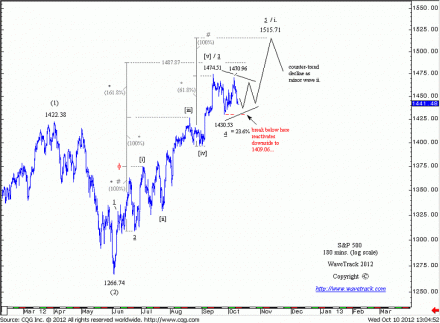
The sell off from last week’s high of 1470.96 has greatly increased the probability for the contracting-symmetrical triangle scenario. This means the S&P should remain within the range between the 1474.51 high and the 1430.53 low during the next several trading days before it stages one finalising advance to original upside at min. 1487.87 or max. 1515.71 to complete the entire upswing from the June low of 1266.74. Only a break below 1430.53 would trigger additional downside potential to 1409.06.
Announcement: Free Week! 29th September – 7th October ‘12
by m.tamosauskas| September 27, 2012 | No Comments
WaveTrack’s ‘Free Week’ begins this coming weekend and its theme centres around two aspects – creating an awareness within the Elliott Wave community of the importance in applying Fibonacci Ratio & Proportion studies – also, offering an insight to the up-coming ‘inflation-pop’ that forecasts a very different outcome for global stock indices during the next 12-18 months than ‘mainstream’ Elliott Wave is purporting.
For new registrants, access is granted to the EW-Compass repot – simply go to www.wavetrack.com and click the ‘Register’ button located at the top of the page, just above the log-in area – complete the registration, then return to the ‘Client Log-ins’ button at the top-left of the navigation area to activate the pop-up menu, then click on EW-Compass to begin your FREE WEEK access to all the latest Elliott Wave analysis and price forecasts!
To watch a video demonstration how the EW-Compass software works, click this link –
http://www.wavetrack.com/elliott-wave-compass.html
Bonus! – we are currently putting the finishing touches to an updated video that describes the current location of stock market trends within the ‘Shock-Pop-Drop’ scenario of the 18 year bear market, how this relates to cycles and price amplitude targets for the next year. We’ll also show how these Elliott Wave forecasts inter-relate to the other asset classes, Currencies, Interest Rates and Commodities. The video will be available during this coming weekend, and its location will be in the ‘video’ tab of EW-Compass.
For more details of the FREE WEEK and to take a look at some examples of our Track Record and Testimonials, please click this link –
http://www.wavetrack.com/track-record/track-record-testimonial-ew-compass.html
S&P 500
by m.tamosauskas| September 21, 2012 | No Comments
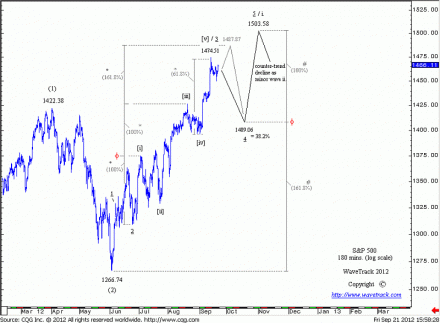
The sell off from the recent 1474.51 high is expected to have begun a counter-trend decline labelled the 4th wave within an ongoing five price-swing advance. Downside targets during the next weeks measure to the fib. 38.2% support at 1409.06 – a reversal from there would trigger the finalising advance to original upside objectives at 1503.58. Very short-term, there is an ‘alternate’ route to the 1409.06 target: the S&P could stage an advance to 1487.87 prior to the decline. This upside resistance is measured by a fib. 161.8% extension of minuette wave [i].
(Become an EW-Compass report subscriber and see how this pattern continues to develop and what’s coming up in the larger time-series).
S&P 500
by m.tamosauskas| September 19, 2012 | No Comments
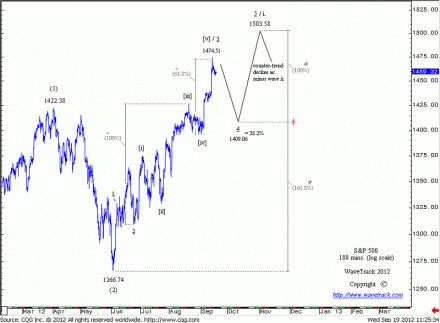
The sell off from last week’s high of 1474.51 is expected to have begun a counter-trend decline labelled the 4th wave within an ongoing five price-swing advance. Short-term downside targets measure to the fib. 38.2% support at 1409.06 – a reversal from there would trigger the finalising advance to original upside objectives at 1503.58.
(Become an EW-Compass report subscriber and see how this pattern continues to develop and what’s coming up in the larger time-series).
S&P 500
by m.tamosauskas| September 14, 2012 | No Comments
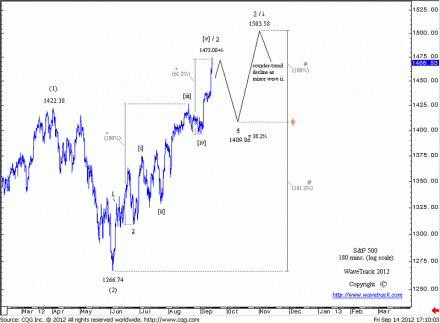
Continued advances above the 1446.00+/- area have promoted this count to ‘preferential’ status. Basis the most recent rallies, original upside targets to 1483.36 seem too low for a possible finalisation of the entire advance in progress from the June low of 1266.74. Instead, objectives have been raised to 1503.58. Note that this scenario interprets the advance from 1266.74 as an impulse sequence within a larger bull market implying that the 1266.74 low will not be broken for the next few years.
(Become an EW-Compass report subscriber and see how this pattern continues to develop and what’s coming up in the larger time-series).
S&P 500
by m.tamosauskas| September 12, 2012 | No Comments
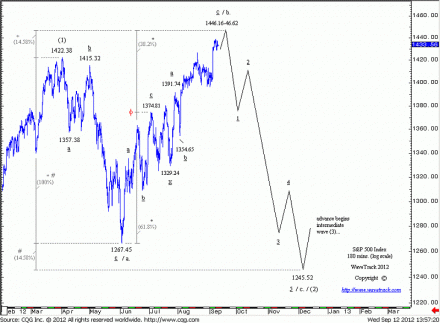
The S&P is at a critical juncture as original upside targets to 1446.16-46.62 are being approached. Any reversal from here would confirm the end of the entire upswing from the June low of 1267.45 and begin an expanding-impulse decline over the next months finalising a larger 3-3-5 pattern that began from the April ’12 high of 1422.38.
Seen from a slightly larger perspective, the S&P is seen engaged in a counter-trend correction that began from the April ’12 high of 1422.38, taking the shape of an expanding flat pattern. This sequence, labelled as intermediate wave (2), is subdividing into minor degree, a-b-c, where wave a. declines to 1267.45 are followed by wave b. advances to 1446.16-46.62. These levels are measured by a fib. 14.58% extension of wave a. and a fib. 61.8% extension of the first zig zag within the double zig zag sequence that is shown to make up the structure for wave b. Once these upside objectives are achieved, await a reversal signature to confirm wave c. declines have begun. Ultimate downside targets for wave c. to be approached during the next months are projected to 1245.52 by a fib. 14.58% extension of wave a.
(Become an EW-Compass report subscriber and see how this pattern continues to develop and what’s coming up in the larger time-series).
