India-CNX Nifty 50
by m.tamosauskas| December 12, 2012 | No Comments
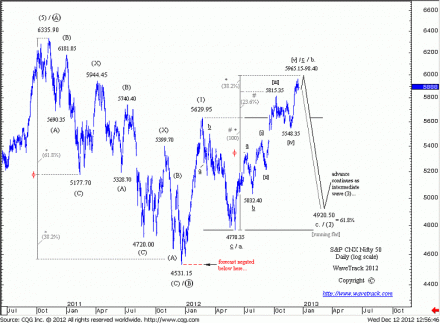
Primary wave B that began from the 2010 high of 6335.90 and unfolded as a counter-trend sequence to wave A is shown to have completed at the 2011 low of 4531.15. The subsequent upswing to 5629.95 is labelled as ending intermediate wave (1). From there, wave (2) counter-trend declines are unfolding into a running flat sequence, a-b-c. Wave a. declines to 4770.35 are followed by wave b. advances that are shown to be underway to idealised upside at 5998.40, the fib. 38.2% extension of wave a. A subsequent reversal from there will trigger wave c. that is expected to decline in the months ahead with ultimate downside to 4920.50, the fib. 61.8% support of wave (1).
(Become an EW-Compass report subscriber and see how this pattern continues to develop and what’s coming up in the larger time-series).
Announcement: Tradersworld Expo Free Week! 10th – 14th December ‘12
by m.tamosauskas| December 11, 2012 | No Comments
The Traders World Online Expo #12 continues into its fifth week with WaveTrack International’s Peter Goodburn presenting his latest Elliott Wave price forecasts for 2013 and beyond. This video broadcast is absolutely FREE! to view, but only THIS WEEK – so don’t miss out!
Dear Elliott Wave enthusiasts,
Peter’s outlook for 2013 describes the 18 year bear market for U.S. indices taking the form of an expanding flat pattern – a total of three phase of price action more literally described as the ‘SHOCK-POP-DROP’ scenario. The second ‘Pop’ or ‘inflation-pop’ phase began when central banks took preventative measures to prevent a global meltdown in the early part of 2009 by lowering interest rates to almost zero and printing money through quantitative easing policies. In contrast to misleading ‘mainstream’ Elliott Wave forecasts, the ‘inflation-pop’ is expected to accelerate asset prices through most of the coming year, 2013. This is expected to translate into new record highs for some global indices and many commodities, although all will participate but perhaps some underperforming.
The FREE viewing of Peter’s presentation is only valid for the Traders World Online Expo #12 during this week so ensure you take some time out to view it.
We look forward to welcoming you!
Most sincerely,
WaveTrack’s Client Support Team.
P.S.: Current subscribers to WaveTrack’s Elliott Wave Compass report are already up-to-date on many of the up-coming themes and price trends for 2013 so you are just a few clicks away from joining us: link.
Apple
by m.tamosauskas| December 10, 2012 | No Comments
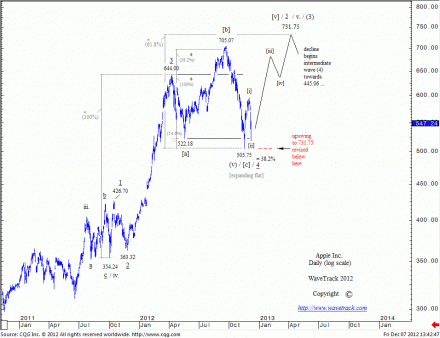
During the last few weeks, Apple Inc. has fluctuated in a volatile trading range between 505.75 and 594.59. There are no changes to preferential wave counts updated recently – a counter-trend decline that began from the April ’12 high of 644.00 completed an expanded flat pattern at the 16th Nov.’12 low at 505.75 and the following advance begins another five wave impulse upswing with targets towards 731.75.
Shorter-term, the advance between 505.75 to 594.59 has unfolded into a five wave (price-swing) formation that asserts continued upside momentum above 594.59 following the 6th Dec.’12 low of 518.63. This is consistent with a continued five wave impulse advance to 731.75 although to validate, prices must accelerate beyond 632.51.
Failure to accelerate above 632.51 would trigger our alternate count (not shown on this blog) that otherwise describes the decline from the September ’12 high of 705.07 to 505.75 as the first stage of a larger counter-trend downswing. A counter-trend rally from 505.75 projects a conclusion to 632.51 prior to a second stage decline with ultimate downside targets towards 445.47. The entire sequence from 705.07 describes a single zig zag pattern labelled a-b-c in minor degree as intermediate wave (4). The difference between these two scenarios is subtle – all depends on the correct identification of the pattern sequence that unfolded during the May-September ’12 advance. As a zig zag, it confirms the Nov.’12 low at 505.75 as completed, whilst as a five wave impulse sequence, this allows a continuation downwards to 445.47. During the next week, both scenarios project a minimum upswing towards 632.51. Its ability to accelerate higher would confirm continuity to 731.75 whilst price-rejection would otherwise confirm a downward attempt to 445.47.
by m.tamosauskas| December 10, 2012 | No Comments
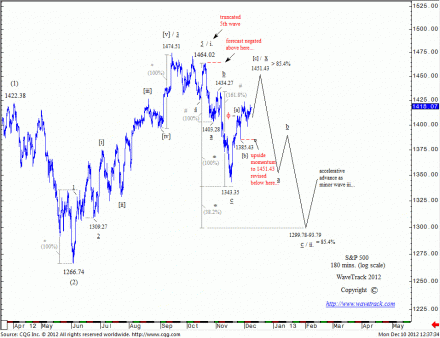
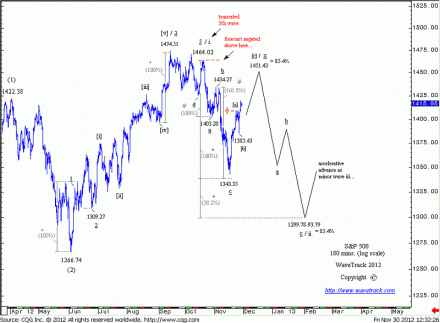
Although the S&P has been underperforming during the last days when compared with the European Eurostoxx 50, the advance from the recent 1385.43 low is still projected towards ultimate upside at 1451.43 during the next weeks. This is because the 1385.43 advance is interpreted as the finalising leg within a larger three price-swing sequence in progress from the November low of 1343.35. Once 1451.43 is achieved, a reversal would signify the continuation of the larger downtrend that began from the mid-October high of 1464.02. Ultimate downside targets measure to the 1300.00+/- area in the months ahead. This forecast is negated above 1464.02. Shorter-term, a break below 1385.43 would revise the additional upside momentum to 1451.43.
(Become an EW-Compass report subscriber and see how this pattern continues to develop and what’s coming up in the larger time-series).
S&P 500
by m.tamosauskas| December 5, 2012 | No Comments
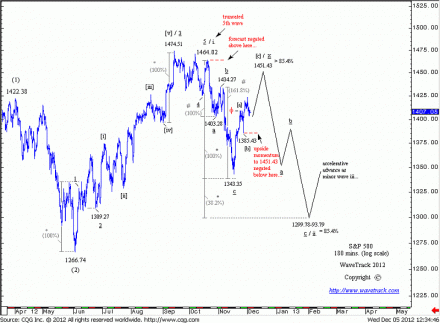
The advance from last week’s low of 1385.43 is interpreted as the finalising leg within a larger three price-swing sequence in progress from the November low of 1343.35. During the next few weeks, the S&P is expected to approach upside at 1451.43 to complete this upswing. Once achieved, a reversal would signify the continuation of the larger downtrend that began from the mid-October high of 1464.02. Ultimate downside targets measure to the 1300.00+/- area in the months ahead. This forecast is negated above 1464.02. Shorter-term, a break below 1385.43 would negate additional upside momentum to 1451.43.
S&P 500
by m.tamosauskas| November 30, 2012 | No Comments
The counter-trend sequence as minor wave ii. two in progress from the mid-October high of 1464.02 is shown unfolding into a double zig zag sequence of minute degree, a-b-c-x-a-b-c. The first zig zag completed at 1343.35 and is now being followed by wave x counter-trend rallies with idealised upside to 1451.43. A reversal signature from there would trigger the secondary zig zag that is projected to ultimate downside at 1299.78 by a fib. 38.2% extension of the first zig zag. This level roughly converges with the fib. 85.4% retracement of minor wave i. one. At this point of time, we still cannot eliminate the possibility of the S&P ending its decline below the June ’12 low of 1266.74. This is because the June-September upswing is actually a mess, a seven price-swing advance to the actual high of 1474.51 and a nine (5 wave impulse with extension) to the ‘truncation’ to 1464.02. If this advance ended a seven wave double zig zag sequence to 1474.51, then the following decline would become the final sequence of a larger expanding flat pattern for intermediate wave (2) with downside targets to 1232.57-26.50
(Become an EW-Compass report subscriber and see how this pattern continues to develop and what’s coming up in the larger time-series).
by m.tamosauskas| November 22, 2012 | No Comments
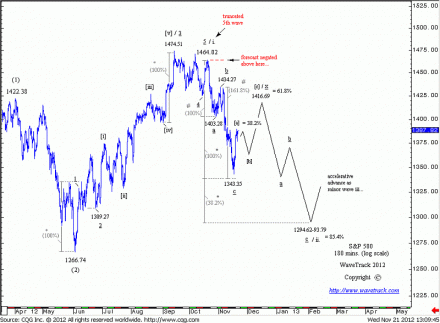
The S&P responded positively from last Friday’s lows of 1343.35 confirming a counter-trend advance has begun as wave ‘X’. Basis the price development so far, it would seem that a deep retracement will ultimately unfold – the last days’ attempt to the fib. 38.2% resistance level at 1388.00+/- whilst unfolding from 1343.35 into a sub-hourly five wave impulse pattern increases this probability so that an eventual zig zag upward rally ends towards the fib. 61.8% area at 1416.69+/-. Naturally, a shorter-term retracement should unfold first.
S&P 500
by m.tamosauskas| November 15, 2012 | No Comments
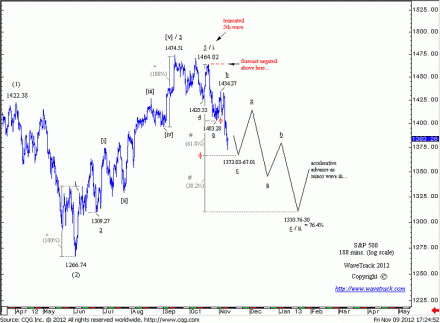
The S&P’s protracted decline during the last several weeks has confirmed the completion of the June upswing at the 18th October high of 1464.02 as a truncated 5th wave. This means that a counter-trend sequence to the entire 1266.74-1464.02 advance is underway which suggests a continued decline during the next couple of months. Latest: short-term interim downside targets measured to 1373.03-67.01 have already been achieved – a reversal from here will trigger a temporary counter-trend rally into idealised upside at 1414.70+/- but could do more. This forecast is negated above 1464.02.
(Become an EW-Compass report subscriber and see how this pattern continues to develop and what’s coming up in the larger time-series).
S&P 500
by m.tamosauskas| November 12, 2012 | No Comments
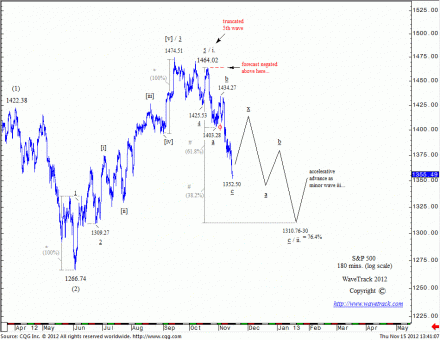
As highlighted in the last update, the S&P’s failure to respond from the 1388.00+/- area has confirmed the completion of the June upswing at the 18th October high of 1464.02 as a truncated 5th wave. This means that a counter-trend sequence to the entire 1266.74-1464.02 advance is underway which suggests a continued decline during the next couple of months. Shorter-term, an interim downside target is measured to 1373.03-67.01 – a subsequent reversal would trigger a temporary counter-trend rally into an idealised upside area of 1414.70+/- but could do more. This forecast is negated above 1464.02.
(Become an EW-Compass report subscriber and see how this pattern continues to develop and what’s coming up in the larger time-series).
by m.tamosauskas| November 7, 2012 | No Comments
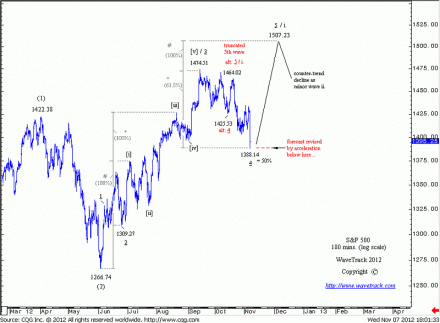
With this week’s break below the 1403.28 low, the S&P has triggered additional downside potential to 1389.44 which has been already achieved with yesterday’s low of 1388.14. A reversal from there is necessary to validate the continuation of the larger upswing that began from the June low of 1266.74. Failure to respond from the 1388.14 level followed by an acceleration below would otherwise confirm that the S&P already completed the larger upswing at 1464.02 with a 5th wave truncation. This would have bearish implications for the next months.
(Become an EW-Compass report subscriber and see how this pattern continues to develop and what’s coming up in the larger time-series).
