Ratio and Proportion Study – Gold November ’12 – January ’13
by m.tamosauskas| January 22, 2013 | No Comments
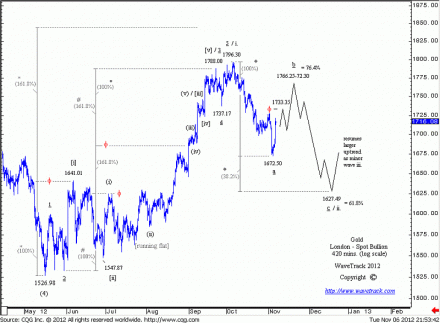
Back in 6th of November ’12 the forecast for gold prices was: ‘Shorter-term, minute wave b’s advance from 1672.50 is itself unfolding into a smaller three wave zig zag, [a]-[b]-[c] (not pictured) with interim upside targets for minuette wave [a] completing towards 1733.35. A temporary retracement decline to follow but holding above 1672.50 as wave [b] but then a final advance for wave [c] to 1766.25-72.30. Once completed, minute wave c is then expected to decline to 1627.49 to finalise the entire corrective decline from 1796.30 ‘
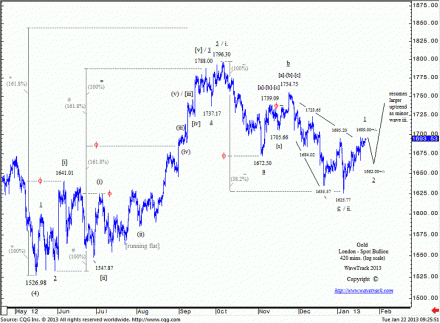
As you can see, the ultimate downside target for minor wave ii. was derived by extending minute wave a by a fib 38.2% ratio – a common ratio metfod used in zig zag patterns.
Early last week gold prices traded lower with a recorded low at 1625.77. A reversal signature from this low gives a lot of creditability to begin new accelerative advance:
(Become an EW-Compass report subscriber and see how this pattern continues to develop and what’s coming up in the larger time-series).
S&P 500
by m.tamosauskas| January 16, 2013 | No Comments
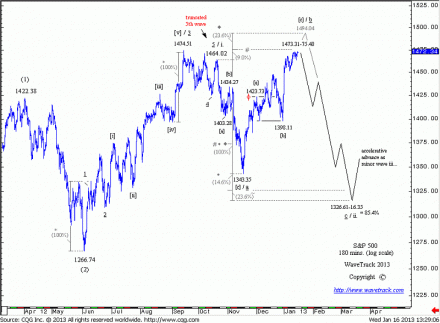
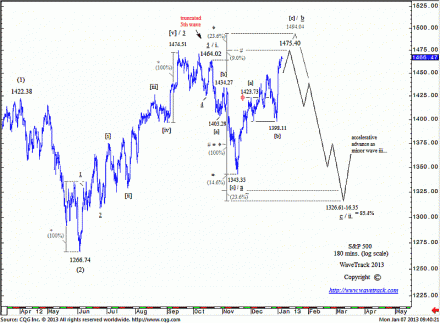
For the time being, the S&P has not reacted from original upside targets at 1475.40. The high so far was recorded at 1473.31, but unless a reversal signature has occurred, we cannot confirm the completion of the entire upswing from the Nov.’12 low of 1343.35. This would initiate declines in the months ahead, with downside measured to 1326.61-16.35. As mentioned in the former updates, acceleration above 1475.40 would otherwise trigger higher targets to 1494.04 – but basis the European and Asian indices which have already traded into upside resistance and reacted from there, this is assigned a lower probability. This forecast is revised only by acceleration above 1494.04.
(Become an EW-Compass report subscriber and see how this pattern continues to develop and what’s coming up in the larger time-series).
S&P 500
by m.tamosauskas| January 10, 2013 | No Comments
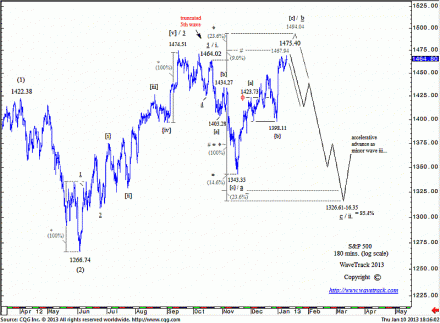
The S&P’s break above 1464.02 has promoted this count to ‘preferential’ status. It implies a bit more upside potential towards idealised targets at 1475.40 prior to a reversal and subsequent downswing to 1326.61-16.35 to finalise a larger expanding flat pattern that began from the 18th October high of 1464.02. An acceleration above 1475.40 would trigger even more upside to 1494.04 but is assigned lower probability due to a comparison with the major European indices that are already approaching original upside targets.
(Become an EW-Compass report subscriber and see how this pattern continues to develop and what’s coming up in the larger time-series).
S&P 500
by m.tamosauskas| January 7, 2013 | No Comments
The S&P’s break above 1464.02 has promoted this count to ‘preferential’ status. It implies a bit more upside potential towards idealised targets at 1475.40 prior to a reversal and subsequent downswing to 1326.61-16.35 to finalise a larger expanding flat pattern that began from the 18th October high of 1464.02. Acceleration above 1475.40 would trigger even more upside to 1494.04 but is assigned lower probability due to a comparison with the major European indices that are already approaching original upside targets. This forecast is revised by acceleration above 1494.04.
(Become an EW-Compass report subscriber and see how this pattern continues to develop and what’s coming up in the larger time-series).
Announcement
by m.tamosauskas| December 21, 2012 | No Comments
Today was the last update before the Christmas holiday festivities begin. We shall take the opportunity to rest the team a little during the following week or so and so the next post will be published early next year, 2013!
Season’s greetings and wishing you success for 2013 – Peter Goodburn, Kamil & Martynas.
S&P 500
by m.tamosauskas| December 21, 2012 | No Comments
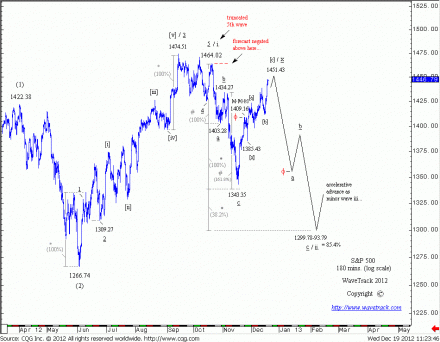
The strong sell off from last Thursday to Friday has increased the probability that the S&P already topped out at 1448.00, slightly short of original upside targets to 1451.43. Although there is the possibility – due to increased short-term volatility – that the S&P could stage a finalising advance and nudge about last week’s high prior to a reversal, the odds are strongly in favour of an immediate downside continuation that would signal the entire counter-trend rally from 1343.35 has completed at 1448.00. Next interim downside objectives then measure towards 1354.40 during the next weeks, ultimate objectives remain at 1299.78-1293.79. This forecast is negated only above 1464.02.
(Become an EW-Compass report subscriber and see how this pattern continues to develop and what’s coming up in the larger time-series).
S&P 500
by m.tamosauskas| December 19, 2012 | No Comments
The S&P staged one additional high last week towards 1438.59 but then quickly reversed. This level can be measured by internal fib-price ratios of the advance from 1343.35, as it precisely hit the fib. 38.2% extension of wave ‘A’ of the secondary zig zag from 1385.43. This corroborates the assumption that the S&P might already have topped out although it fell short of original upside targets at 1451.43. Expect the index to continue downwards during the next few months with ultimate targets remaining unchanged towards 1299.78-93.79. This forecast is revised above 1438.59, but negated only above 1464.02.
(Become an EW-Compass report subscriber and see how this pattern continues to develop and what’s coming up in the larger time-series).
Summary
by m.tamosauskas| December 17, 2012 | No Comments
A comparison between U.S. and European indices suggests the mid-November upswing has completed. For the S&P and Dow Jones, this advance represents wave ‘X’ within a larger counter-trend double zig zag decline that began from the October high whilst for the Eurostoxx 50, it ends a 5th wave within the larger impulse advance that began from its June ’12 low. Whilst the S&P and Dow are now expected to decline into a secondary zig zag sequence into a late January low, European indices begin a broader counter-trend decline as a correction to their June impulse advance. Fib-price-ratio measurements project a decline of between -8% to -10%. For the S&P, downside targets from the recent high of 1438.59 measure towards 1299.78-93.79 whilst the Dow Jones measures to 12221.50-069.40. A similar percentage decline for the Eurostoxx 50 will simply retrace levels back towards support of 4th wave of preceding degree. Spain’s IBEX has fulfilled upside targets and is set to join in an overall decline towards downside targets of 7270.20. Asia’s Hang Seng index has extended gains but is closing in on upside targets towards 23195.40 to complete a five wave impulse advance from its June low. Japan’s Nikkei 225 is reaching higher but within fib-price-ratio tolerance to complete a five wave impulse advance from the early October low with targets towards 9791.46.
WTI Track Record Portfolio
by m.tamosauskas| December 13, 2012 | No Comments
Dow Jones 30
by m.tamosauskas| December 13, 2012 | No Comments
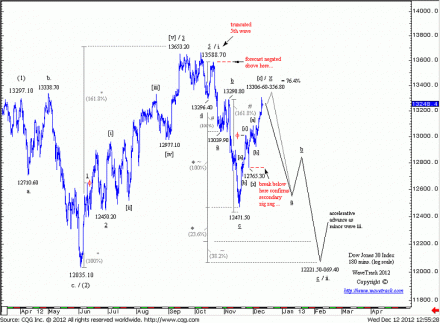
The Dow Jones is already approaching original upside targets at 13356.80. This means that any reversal from current levels would validate the resumption of the larger downswing from 13588.70. Downside targets to be achieved during the next few months remain towards 12221.50-069.40. This forecast is negated above 13588.70. Shorter-term, a break below 12765.30 would confirm the continuation of the larger downswing.
(Become an EW-Compass report subscriber and see how this pattern continues to develop and what’s coming up in the larger time-series).
