S&P 500 – still searching for a top
by m.tamosauskas| March 13, 2013 | No Comments
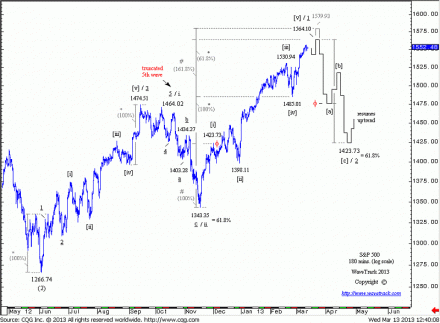
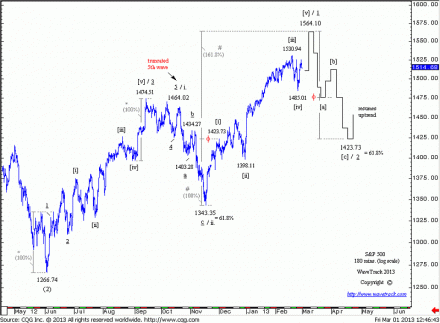
The S&P is already close to original upside at 1564.10 and the substructure of the advance from 1485.01 suggests one higher high which converges with the 1564.10+/- area but could also extend to max. upside at 1579.93. Seen from the larger perspective, the advance from the Nov.’12 low of 1343.35 is seen as the finalising leg of an ongoing five price-swing sequence that began from the Nov.’12 low of 1343.35. A reversal from 1564.10+/- would initiate counter-trend declines in the weeks ahead, with ultimate downside measured to the fib. 61.8% support at 1423.73.
(Become an EW-Compass report subscriber and see how this pattern continues to develop and what’s coming up in the larger time-series).
Dow at the new all-time high!
by m.tamosauskas| March 6, 2013 | No Comments
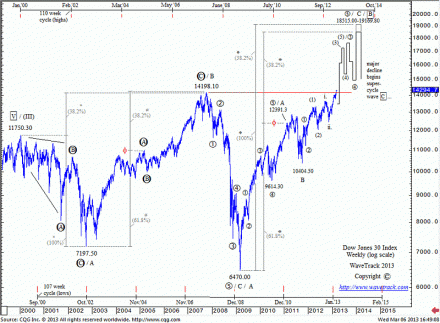
Back in December 2010 when Dow was trading at 11500 we have made a forecast for a break to the new all-time high during the next few years. For the record, please take a look at the video we have published in our site: https://www.wavetrack.com/outlook-forecasts-2011.html
Yesterday Dow broke to the all-time high confirming our ‘inflation-pop’ scenario:
During the road to ultimate upside targets there will be lots of bumps and pits. Be a step ahead with Wavetrack International: Become an EW-Compass report subscriber and see how this pattern continues to develop in different time-series.
S&P 500 – topping process
by m.tamosauskas| March 1, 2013 | No Comments
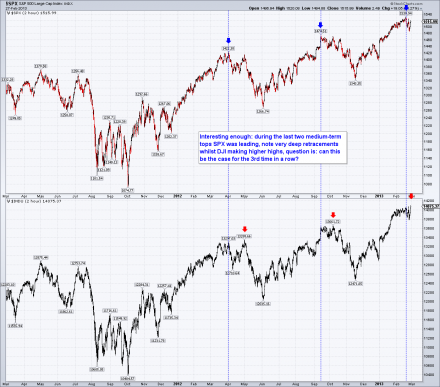
Really crazy and volatile week! Some good tips from previous two medium-term tops on S&P 500:
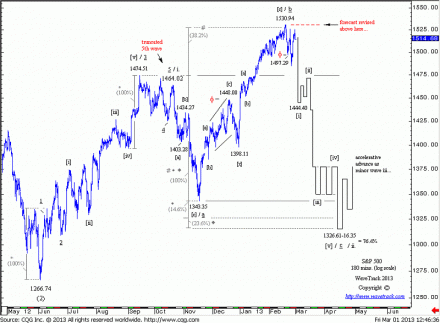
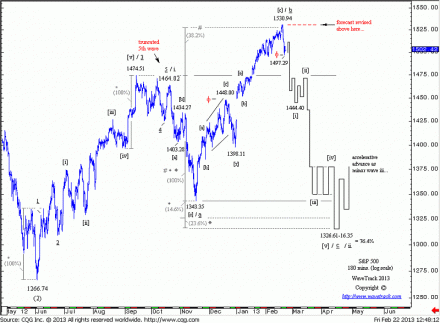
We maintain our bearish outlook for the next few months. Last week’s advance remained below the 1530.94 high – thus, the S&P has set the stage for a downside acceleration that would confirm a larger downswing is in progress as the finalising part of the expanding flat sequence that began from the Oct.’12 high of 1464.02. Ultimate downside objectives to be achieved during the next few months measure to 1326.61-16.35:
However, today we are introducing the secondary alternative count:
This new ‘alternate’ count describes the upswing from the Nov.’12 low of 1343.35 as incomplete and therefore advocates additional upside potential towards ultimate targets at 1564.10 to finalise it. This is based on the assumption of a five price-swing advance from 1343.35 where the 4th wave completed at last week’s low of 1485.01 – now, a finalising 5th to 1564.10 is expected. A break below 1485.01 will revise this forecast:
Lets see what happens today, GL!
S&P 500 – trend is turning down
by m.tamosauskas| February 22, 2013 | No Comments
The sell off from the 1530.94 high has occurred in five waves. Now, a short-term three price-swing rally is expected, followed by a continuation below 1497.29. This would confirm the reversal signature and, thus, the continuation of declines in the next several weeks. Basis a fib. 161.8% extension of the 1530.94-1497.29 sell off, downside support to complete the 1st wave within the larger five wave impulse decline is measured to 1444.40. Ultimate objectives remain towards 1326.61-16.35. An advance above 1530.94 will revise this forecast.
(Become an EW-Compass report subscriber and see how this pattern continues to develop and what’s coming up in the larger time-series).
Apple – the decline remains intact
by m.tamosauskas| February 22, 2013 | No Comments
In 11th of February a short-term setup was presented:
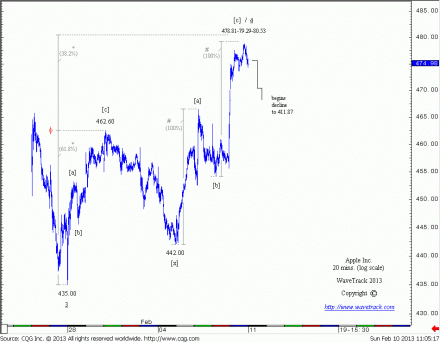
‘Apple Inc. provides an attractive short-term trading setup: the expected counter-trend rebound from the 435.00 price level is unfolding into a double zig zag pattern labelled [a]-[b]-[c]-[x]-[a]-[b]-[c] in minuette degree. Ratio and proportion analysis again provides an excellent roadmap where this advance is expected to complete. Ultimate upside targets are measured towards 478.81-480.53. This is derived by extending the first zig zag sequence by a fib. 61.8% ratio to 480.53 that closely converges with an equality between waves [a] and [c] of the secondary zig zag pattern. A reversal signature would indicate declines to resume larger downtrend towards 411.87. The behavior of this equity during the next several trading session could be a very useful hint for the broader US equity market, since Apple Inc. is a big component in S&P 500 and Nasdaq Composite indices. Good luck!’
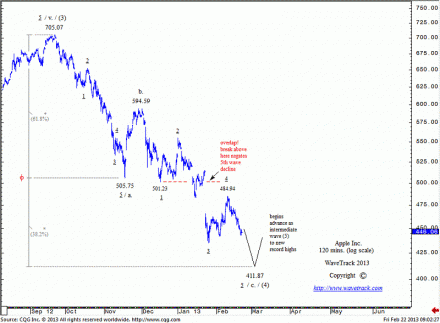
An updated chart as of yesterday’s trading session shows that the decline as an ongoing intermediate wave (4) remains in tact:
It has exceeded slightly our original upside targets with a recorded high at 484.94 but no damage have been done to the overall pattern. The advance from the low of 435.00 is clearly composed of three price-swings (waves). A reversal has been trigered ( and also on global stock indices). The stop price level for this setup is 501.23 – since 4th wave is not allowed to enter into 1st wave’s territory. Good luck!
India-CNX Nifty 50 – top is in?
by m.tamosauskas| February 21, 2013 | 4 Comments
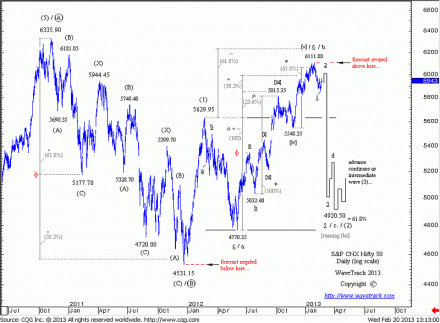
The current rally from 5853.90 is labelled as the 2nd within an ongoing five wave impulse decline that began from the Jan.’13 high of 6111.80. Short-term upside resistance is measured to 6012.25 basis a fib. 61.8% retracement. A reversal from there would confirm downside continuation during the next several weeks, with unchanged targets towards 4920.50. <b>This forecast is revised above 6111.80.</b>
Learn more about Ratio & Proportion at www.wavetrack.com
(Become an EW-Compass report subscriber and see how this pattern continues to develop and what’s coming up in the larger time-series).
Technical Error
by m.tamosauskas| February 20, 2013 | No Comments
Dear Readers,
Due to a technical blog error last week’s blog posts have, unfortunately, not been published. Therefore, we decided to republish the posts this week as we think they are still relevant. Thank you for your patience. GL!
S&P 500 February 07 ’13
by m.tamosauskas| February 7, 2013 | 2 Comments
Continuation to the upside has necessitated extending original target levels of 1506.77-07.29 to max. upside at 1527.93 by a fib. 38.2% ratio of the 1343.35-1474.51 range. A lower target towards 1516.71 that is already being approached can be projected by a fib. 61.8% extension of the initial Nov.-Dec.’12 advance of 1343.35 to 1448.00. Thus, a reversal from current (or slightly higher) levels would still confirm the conclusion of the entire Nov.’12 advance and initiate declines in the weeks ahead to finalise the larger counter-trend correction that began from the mid-October high of 1464.02. Ultimate downside to be achieved remains towards 1326.61-16.35.
(Become an EW-Compass report subscriber and see how this pattern continues to develop and what’s coming up in the larger time-series).
S&P 500 January 28 ’13
by m.tamosauskas| January 28, 2013 | 4 Comments
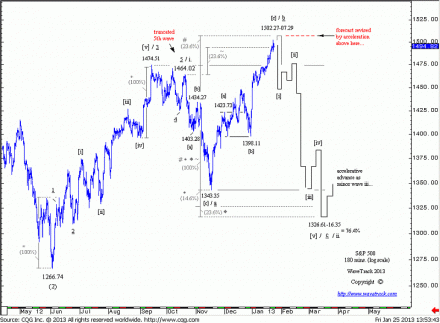
[No immediate change] The S&P continued higher and is now approaching higher resistance towards 1506.77-1507.29. Basis a comparison with the Dow Jones that is expected to trade a little bit higher, it is possible that this area will be reached, but any reversal from current levels would already confirm the completion of the entire Nov.’12 advance from 1343.35. Subsequent declines in the weeks ahead are measured to ultimate downside at 1326.61-16.35. This forecast is revised only by acceleration above 1506.77-07.29.
(Become an EW-Compass report subscriber and see how this pattern continues to develop and what’s coming up in the larger time-series).
S&P 500 January 23 2013
by m.tamosauskas| January 23, 2013 | 4 Comments
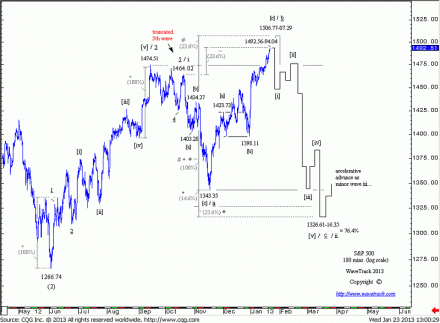
[No immediate change] The S&P is now approaching original upside targets towards 1494.04 – a reversal from here is expected to confirm the completion of the entire Nov.’12 upswing and initiate declines in the weeks ahead. Failure to reverse from current levels could extend the advance to higher resistance at 1506.77-07.29, but the probability (based on momentum studies) clearly favours an immediate sell off. Subsequent downside targets remain at 1326.61-16.35. This forecast is revised only by acceleration above 1506.77-07.29.
(Become an EW-Compass report subscriber and see how this pattern continues to develop and what’s coming up in the larger time-series).
