S&P 500 is never going down again, do you believe it?
by m.tamosauskas| May 10, 2013 | No Comments
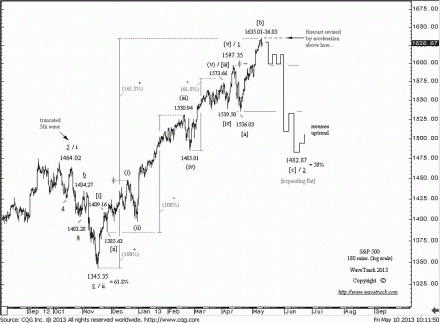
The substructure of the advance from the April low of 1536.03 clearly indicates only a three price-swing rally to current levels. This shifts the probability in favour of this count which has been promoted to ‘preferential’ status. It suggests an expanding flat counter-trend sequence is unfolding from the mid-April high of 1597.35, with wave ‘A’ ending at 1536.03 and wave ‘B’ at current levels. A reversal from here would thus initiate wave ‘C’ declines in the next several weeks ahead, with ultimate downside measured to 1482.87. Anacceleration above 1636.83 will revise this forecast – in this case, refer to count #2.
(Become an EW-Compass report subscriber and see how this pattern continues to develop and what’s coming up in the larger time-series).
S&P 500 – seconadry count becomes primary
by m.tamosauskas| May 3, 2013 | No Comments
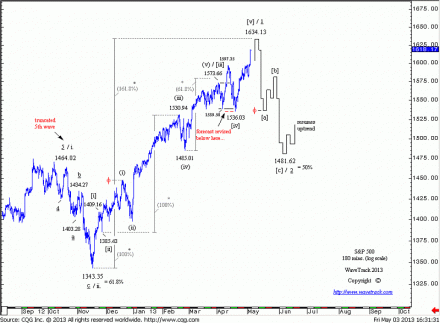
Although shorter-term counter-trend declines are due now, Tuesday’s break above 1597.35 has corroborated upside targets to 1634.13 during the next weeks. This would confirm the completion of the entire five wave impulse advance from the Nov.’12 low of 1343.35. A reversal signature from 1634.13+/- would then initiate a sustained correction in the months ahead with idealised downside measured to 1481.62 basis a fib. 50% retracement. An immediate decline below 1536.03 would negate upside targets to 1634.13.
Eurostoxx 50
by m.tamosauskas| April 26, 2013 | No Comments
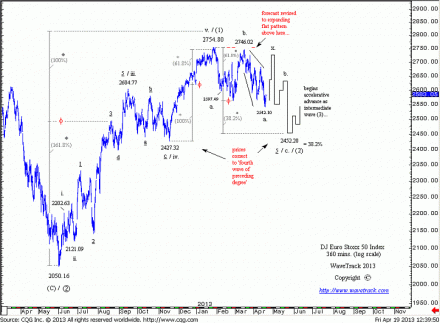
The advance from the April low of 2542.10 appears to be impulsive in nature. This increases the probability of an upside continuation during the next weeks and therefore promotes this count to ‘preferential’ status. It describes the counter-trend correction in progress from the 2754.80 high as unfolding into an expanding flat pattern – current rallies are labelled as wave ‘B’ within this sequence, with upside potential measured to 2807.54. Once achieved, await a reversal signature to confirm the finalising price swing with downside targets to 2465.25. This forecast is revised only by immediate declines below 2542.10.
(Become an EW-Compass report subscriber and see how this pattern continues to develop and what’s coming up in the larger time-series).
S&P 500 – secondary EW count
by m.tamosauskas| April 24, 2013 | No Comments
This is our secondary count for S&P 500 cash index. The strong rally from last week’s low of 1536.03 has increased the probability of this scenario that advocates upside continuation during the next few weeks – a break above 1597.35 would confirm higher targets to 1634.13 to finalise the larger advance from the Nov.’12 low of 1343.35. A subsequent reversal from 1634.13+/- would then begin a sustained counter-trend decline in the months ahead. This count is revised below 1536.03.
(Become an EW-Compass report subscriber and see how this pattern continues to develop and what’s coming up in the larger time-series).
S&P 500 – shows weakness
by m.tamosauskas| April 19, 2013 | No Comments
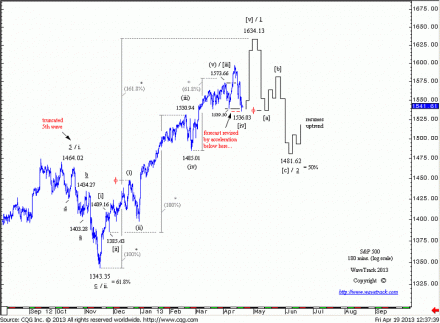
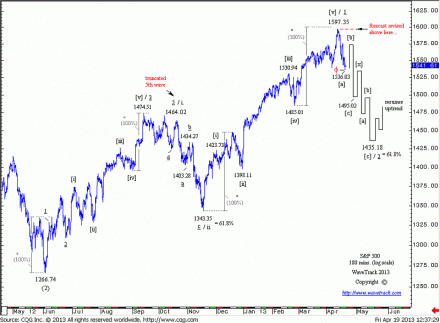
The S&P sold off sharply from its 1597.35 and is now in the process of confirming a reversal signature. The initial decline to 1536.03 unfolded into a five wave sequence – now, a counter-trend three wave upswing is expected prior to downside continuation. Interestingly, the 1536.03 low is very close to a golden ratio cut basis the original interim objectives at 1495.02. This suggests that the pattern labelled as minute wave 2 is going to unfold into a double zig zag sequence instead of a single type with the first zig zag projected to complete at 1495.02 and the secondary at ultimate targets to 1435.18, the fib. 61.8% retracement of the preceding 1343.32-1597.35 advance. A break above 1597.35 would revise this forecast – see fig. #2.
(Become an EW-Compass report subscriber and see how this pattern continues to develop and what’s coming up in the larger time-series).
S&P 500
by m.tamosauskas| April 12, 2013 | No Comments
Early this week we have extended ultimate upside targets towards 1600+/-. The primary count advocates for an immediate completion of the upswing that started in mid-November’12 however, alternative count supports higher levels prior a counter-trend decline.
(Become an EW-Compass report subscriber and see how this pattern continues to develop and what’s coming up in the larger time-series).
S&P 500 – reversal still not confirmed…
by m.tamosauskas| April 5, 2013 | No Comments
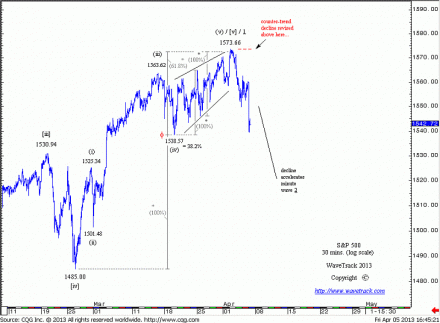
S&P 500 cash index needs a break below 1.538.53 to confirm the start of a new downtrend. Overall, the reversal as mentioned seems imminent and hopefully later today we will get a confirmation. Good luck!
(Become an EW-Compass report subscriber and see how this pattern continues to develop and what’s coming up in the larger time-series).
Reversal is imminent!
by m.tamosauskas| April 3, 2013 | No Comments
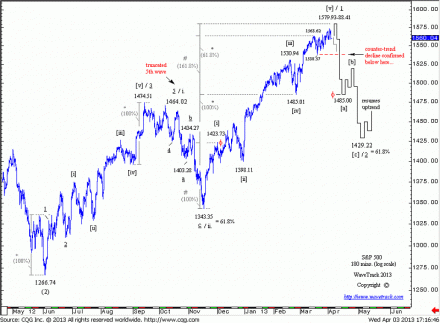
The S&P already has achieved min. upside targets to 1572.63 and the short-term ending-diagonal scenario shown in the last EW-Compass issue would suggest a reversal from current levels to begin a sustained counter-trend decline in the months ahead. The most recent rally could extend higher towards 1579.93-88.41 during the next trading sessions but its not necessary. This area is measured by a fib. 61.8% extension of the 1343.35-1485.01 range and a fib-correlative 61.8% ratio of the 1485.00-1563.62 rally added to the mid-March low. Thus, although the S&P is at a general juncture point, the reversal area is hard to determine as the fib-price-ratio measurements allow for a completion of the entire Nov.’12 upswing at current or plus one per cent levels. A break below 1538.57 would in any case confirm the larger counter-trend decline is underway.
S&P 500
by m.tamosauskas| March 22, 2013 | No Comments
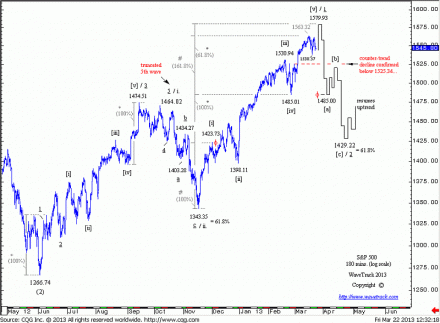
Minor wave ii. two is shown as already having completed at the Nov.’12 low of 1343.35. The implication is that now a five wave expanding-impulse sequence is underway as minute wave 1. Min. upside targets to 1564.10 basis a fib. 161.8% extension of minuette wave [i] have already been approached. A slightly higher target can be measured to 1579.93 by extending waves [i]-[iv] by a fib. 61.8% ratio.
Next week I am taking holiday, so there won’t be blog updates, however EW-Compass will be published as usual – twice a week. Beforehand I would like to wish all of you happy Easter and good luck in a markets!!!
(Become an EW-Compass report subscriber and see how this pattern continues to develop and what’s coming up in the larger time-series).
EUR / US$ – bottom?
by m.tamosauskas| March 18, 2013 | No Comments
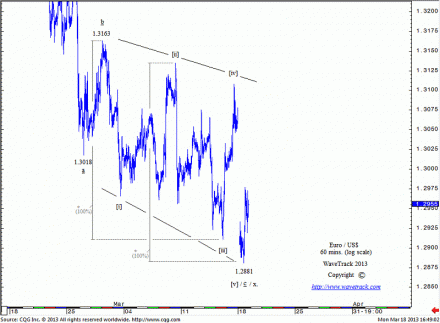
In our latest EW-Compass report published last Friday for our subscribers we noted: ‘Minor wave x. is a correction to the 1.2042-1.3711 advance that unfolded as a single zig zag. Wave x. began from 1.3711 and is shown unfolding into a double zig zag sequence, subdividing into minute degree, a-b-c-x-a-b-c. The first zig zag already completed at the 1.3146 low and was followed by a swift wave x counter-trend rally to 1.3319. Now, a fib-correlative 100% equality ratio between the first and secondary zig zag projects to ultimate downside targets at 1.2770. Shorter-term structure, however, suggests a higher conclusion towards 1.2884-66.’ Today’s actual low was traded at 1.2881 and we immediately recognised it as a reversal signature. Short-term profits can now be protected by placing stop at 1.2919. GL!
(Become an EW-Compass report subscriber and see how this pattern continues to develop and what’s coming up in the larger time-series).
