US$ Index confirms Ending diagonal pattern!
by m.tamosauskas| June 12, 2013 | No Comments
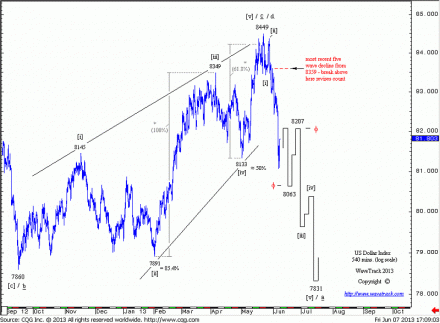
The ending-expanding diagonal as minute wave c completed minor wave d. within a multi-year, range-trading triangle pattern. This suggests a downswing for the next months as wave e. of the triangle will unfold. Minute wave c subdivided into minuette degree, [i]-[ii]-[iii]-[iv]-[v], with wave [ii] retracing a fib. 85.4% ratio of wave [i] and wave [iv] about 50% of wave [iii]. A fib-correlative 61.8% ratio of wave [iii] added to the end of wave [iv] measures close to the achieved high of 8449, which adds evidence to a possible completion there.
Stlg/US$ – resumes the larger uptrend!
by m.tamosauskas| June 7, 2013 | No Comments
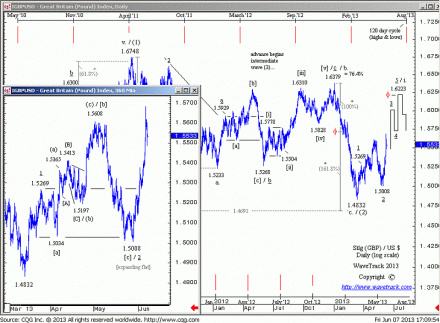
For some it was quite hard to imagine this count, but here we go – a break above gives us more confidence it’s resuming its larger uptrend! Sterling quickly exceeded upside resistance at 1.5439 and has thus validated a successive 1-2-1-2 sequence from the 1.5008 low with 3rd of 3rd acceleration now in progress. This should restrict counter-trend declines to small amplitudes and spark additional upside in the months ahead. Basis the larger perspective that projects upside to 1.8750+/- during the next several months, a golden cut projects interim targets to 1.6223 for the initial upswing from 1.4832.
Nikkei 225 – temporary oversold
by m.tamosauskas| June 5, 2013 | No Comments
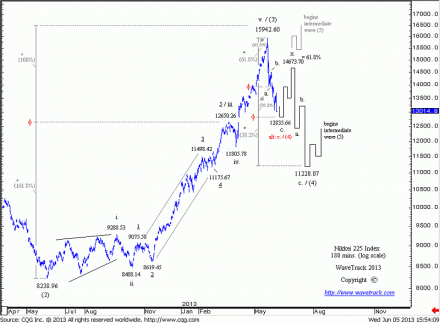
The Nikkei sold off sharply during the last days and is now already approaching downside objectives towards 12835.66. This swift decline puts a completion of the entire counter-trend sequence from the 15942.60 high into doubt. It seems more likely that the 15942.60-12835.66 decline will constitute only the first part of a more complex downswing that will continue towards 11220.07 in the months ahead. A reversal signature from 12835.66 thus is expected to initiate wave ‘X’ counter-trend advances with idealised targets to the fib. 61.8% resistance at 14673.70. A continuation higher that would exceed the May high of 15942.60 cannot be ruled out at the moment but is deemed less likely.
US$ Index – possible ending diagonal
by m.tamosauskas| May 31, 2013 | No Comments
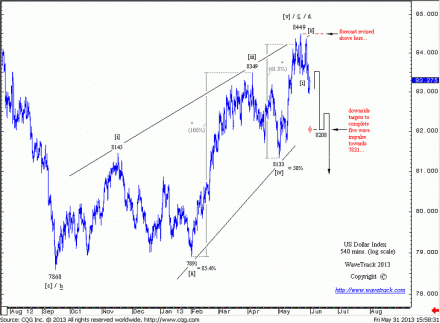
With additional declines during the latter half of last week, the US$ index has significantly raised the probability of downside continuation in the months ahead as it confirmed a reversal signature from the 8449 high. This validates the completion of an ending-contracting diagonal that began at the Sep.’12 low of 7860 and initiates a five wave downswing with measured targets to 7831. Cutting the 8449-7831 range by the golden section, interim downside objectives are measured to 8208.
Wondering about the bigger picture?
by m.tamosauskas| May 29, 2013 | No Comments
Check out the latest ‘inflation-pop’ update here.
Eurostoxx 50 drops in five wave sequence
by m.tamosauskas| May 24, 2013 | No Comments
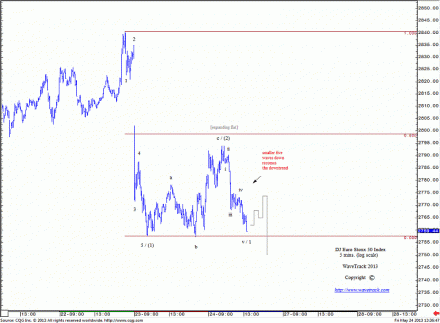
Very short-term aspect, but very important in our opinion. Eurostoxx 50 declined in a five wave sequence from yesterday’s high – suggesting the larger declines have resumed. The following counter-trend rebound is expected to unfold into a single zig zag and once completed, acceleration to the downside is expected.
Stock market commentary
by m.tamosauskas| May 23, 2013 | No Comments
The S&P’s upside progress from the mid-November low of 1343.35 describes an Elliott Wave five wave impulse pattern approaching completion. Two fib-price-ratio measurements are used to define its completion – first, extending waves 1-4 by a fib. 61.8% ratio projects to 1668.68; this has now been surpassed during the last couple of days – second, a fib. 61.8% correlative ratio of waves 1-3 added to the 4th wave low of mid-April projects wave 5 to 1693.83. With the 3rd wave already designated as the ‘extended’ sequence of the larger impulse advance, the 1693.83 calculation should be enough to terminate the 5th wave. Slight deviations may occur but we await price rejection and a subsequent reversal signature before confirming a counter-trend decline is underway. A return back to 4th wave ‘preceding degree’ would be appropriate as this converges with the fib. 38.2% retracement level towards 1550.57. This represents a depreciation from the high of about -8.5% per cent. The Dow’s equivalent 5th wave advance now measures exactly as its 1st wave although it could trade slightly higher before joining the S&P reversal. Interestingly enough, our European benchmark the Eurostoxx 50 by comparison has gained little beyond its 3rd wave high of late January and appears precariously top-heavy as if awaiting its counterparts to complete into measured highs before beginning a larger counter-trend decline. In Asia, the Hang Seng remains below its January high and is delicately poised to resume its counter-trend decline. The Nikkei rolls ahead but our maximum measured upside target towards 16488.75 for the completion of its five wave advance from last June’s low of 8238.96 could fall short if the S&P begins an immediate reversal.
Silver – probably the biggest opportunity in commodities right now!
by m.tamosauskas| May 21, 2013 | 1 Comment
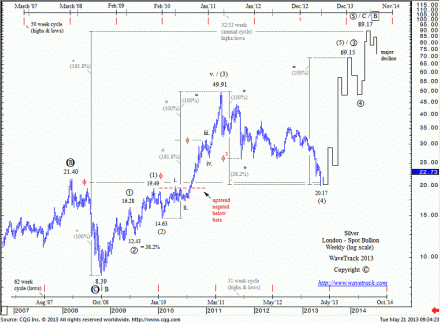
A major liquidation sell-order was received by the major bullion houses in early Asian trading that resulted in silver prices staging a sharp decline in early trading Monday having closed last week at 22.40 with prices tumbling to a low at 20.17.
The low at 20.17 has ‘spiked’ straight into the downside targets that measured to 20.37. The re-action afterwards was an immediate reversal upswing with current levels trading at 21.38. Such action is commonly associated with a reversal, and the fact that it has occurred into the target zone suggests the decline has completed.
Reminder: watch this video that shows the long and medium-term Elliott Wave outlook for WaveTrack’s gold and silver price development forecast. It provides insights to the five wave impulse advance development from the October 2008 lows updating its current location within the trend and explains how recent declines in April 2013 fit into the larger picture.
(Become an EW-Compass report subscriber (click here) and see how this pattern continues to develop and what’s coming up in the larger time-series).
S&P 500 Forecast May 2013 – Daily Chart
by m.tamosauskas| May 17, 2013 | No Comments
Here we are providing the bigger picture which supports our ‘inflation-pop’ scenario (for more details you can always can check the more detailed explanation in our 2013 forecast, a video cut has been published in youtube: VIDEO ).
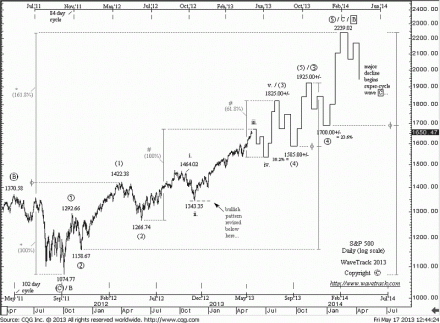
The main difference in this updated version of our daily chart is the restricted downside amplitude of the shorter-term downswing labelled as minor wave iv. Previous daily updates had shown downside potential to 1481.62, but the more recent development of the Nov.’12 advance from 1343.35 suggests a more limited sell-off to idealised targets at the 1535.00+/- from current levels or even 1550.00+/- should the S&P continue towards 1690.00+/- during the next weeks. The general frame, however, remains consistent with previous daily updates advocating an upswing during the next several months with ultimate targets measured to 2239.02. A decline below 1343.35 would revise this forecast.
(Become an EW-Compass report subscriber and see how this pattern continues to develop and what’s coming up in the larger time-series).
Gold and Silver price analysis
by m.tamosauskas| May 15, 2013 | No Comments
Please watch this video for a long and medium-term Elliott Wave outlook of gold and silver price development. This presentation provides insights to the five wave impulse advance development from the October 2008 lows updating its current location within the trend and explains how recent declines in April 2013 fit into the larger picture:
Gold and Silver <- on youtube.com
