DJ Utilities
by m.tamosauskas| July 24, 2013 | No Comments
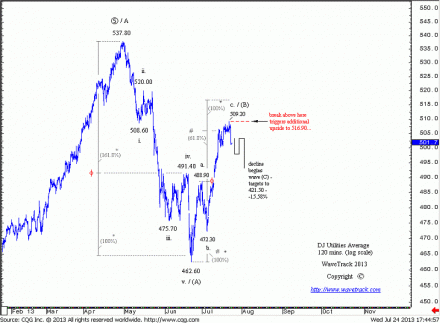
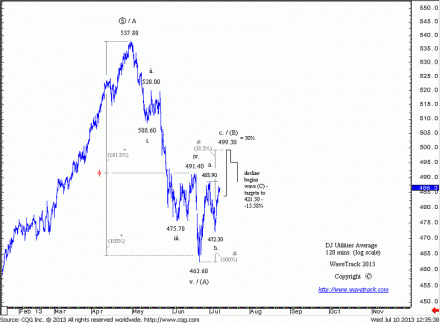
A short-term reversal signature has already occurred pulling prices lower almost 2%. This significantly increases the probability of a completion of the entire counter-trend swing from 462.60 at this week’s high of 509.20 which would confirm downside continuation during the next several weeks ahead, with ultimate objectives measured to 421.50-15.58. However break above 509.20 will trigger additional upside to 516.90.
New all time high, what’s next?
by m.tamosauskas| July 19, 2013 | No Comments
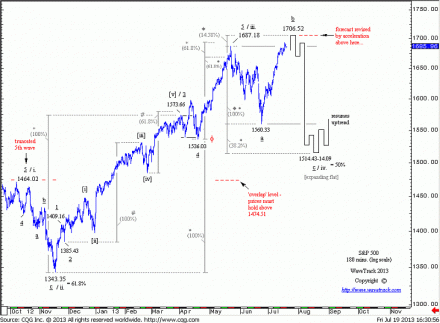
With a break above the May high of 1687.18, this count has been promoted to ‘preferential’ status. It advocates limited upside potential from current levels towards idealised targets at 1706.52. Await a reversal from there to confirm the completion of the June ’13 advance and initiate declines in the weeks ahead. Ultimate downside is then projected towards 1514.43-14.09 to finalise the larger counter-trend sequence in progress from the May high. This forecast is revised by acceleration above 1706.52.
Alternative S&P 500 count
by m.tamosauskas| July 17, 2013 | No Comments
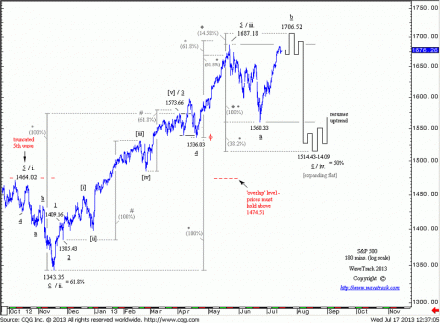
This count will be promoted to ‘preferential’ status should the S&P continue higher and break above the May high of 1687.18. It would trigger immediate upside potential to 1706.52 during the next trading days – a reversal from there would initiate a larger downswing to 1514.43-14.09 in the weeks ahead to finalise the larger ‘expanding flat’ sequence that dates back to the May high.
DAX is also quickly approaching its ultimate upside targets
by m.tamosauskas| July 12, 2013 | No Comments
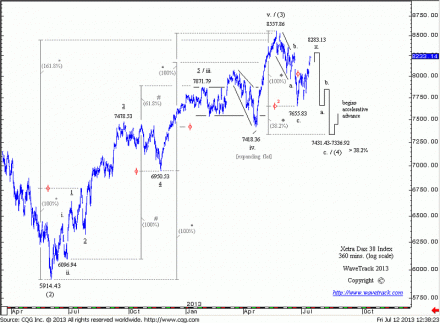
Another market indicating about limited upside potential during the next several days. With additional upside during the latter half of last week, the Dax has traded into the 8199.51-8283.13 area. This sets the stage for a reversal signature from current levels that would confirm the completion of the counter-trend upswing from the June low of 7655.83 and initiate declines in the weeks ahead with unchanged downside objectives measured to 7431.43-7336.92.
Back to regular update schedule :)
by m.tamosauskas| July 10, 2013 | No Comments
This time about DJ Utilities index – this special feature depicts the wave sequence for the Dow Jones Utilities Average from the late April high of 537.80. As the decline from there into the June low of 462.60 unfolded into a clearly discernible five price-swing sequence, it prevents us from thinking about sustained upside potential from current levels – remember that a five wave pattern (unless it is not part of a larger flat structure) requires another five wave sequence to exceed the previously established price extreme.
Free Week ends tonight
by m.tamosauskas| July 3, 2013 | No Comments
Our free week campaign ends tonight, but you can still register here and get access for our EW-Compass reports for the next week. Moreover, we have uploaded our last flagship monthly EW-Navigator report in a special tab. Enjoy! 🙂
EuroStoxx 50
by m.tamosauskas| July 1, 2013 | No Comments
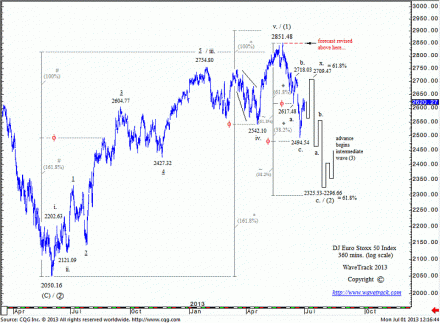
Original short-term upside to 2625.29 has been achieved but as in the case of the U.S. indices, the substructure from last week’s low of 2494.54 implies an upside continuation. Idealised targets measure to 2709.47, the fib. 61.8% retracement – await a reversal signature there to confirm downside continuation in the weeks ahead. Ultimate downside objectives remain towards 2325.53-2296.66. The revision level for this forecast is at 2851.48.
FREE WEEK starting tonight!
by m.tamosauskas| June 26, 2013 | 2 Comments
Tonight we are lounching our free week campaign, later today the newest EW-Compass will be published and available for all registrants! The team is realy working heavy to bring you the best quality report!
Register here.
Don’t miss the upcoming FREE WEEK!
by m.tamosauskas| June 19, 2013 | No Comments
Don’t miss the chance to check the EW-Compass report for free and decide if it is suitable for your trading/investing style! The EW-Compass report is published twice a week, Monday & Thursday and focuses on identifying & forecasting short-term price trends and reversal levels for many of the major markets including stock indices, bonds currencies and commodities. Our EW analysis utilises a combination of three differing aspects to compliment the wave counting process – ‘ratio & proportion’, positive/negative correlations & cycles – each contribute to the pattern building process. Next week, beginning from 26th of June we are announcing a free access to this report!
Please register here: pre-registration for the EW-Compass Free Week starting on 26th June 2013.
P.S.: You will receive an email informing you when you can login on the 26th June 2013!
Subscriptions to the EW-COMPASS report include:
- Elliott Wave updates published twice weekly illustrating short-term perspectives for the major markets
- contracts covered each week will typically include selections from this list: S&P 500, Dow Jones, Nasdaq Comp., EuroStoxx 50, Ftse 100, Nikkei 225, Hang Seng, Seoul Composite Index (Kospi), S&P CNX Nifty 50, US10yr yield, De10yr yield, US$ Dollar Index, US$/GBP, Euro/US$, US$/Yen | Gold, Silver & Crude Oil
- username & password access to the EW-COMPASS system to view all charts online
- contracts combine various asset classes from differing locations – USA, Europe & Asia
- each report shows breakdown of each asset class for individual selection or select scroll-through in sequence
- large viewing area for each chart plus easy to read descriptive text
- ‘right-click’ functionality to select different contracts, time-periods and ‘alternate counts’
- tutorial charts depict the main pattern unfolding for each chart/forecast + permutations
- download each report in .pdf format
- print/download individual charts
- video presentations clarifying specific contract correlations when they occur
- Access to archived reports
S&P 500 mid-term trend remains bullish
by m.tamosauskas| June 14, 2013 | 4 Comments
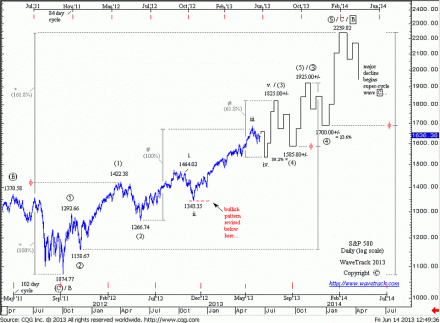
Despite some sharp price movements, the overall pattern that started in early October ’11 remains incomplete. Cycle wave C’s advance that began the concluding sequence of the larger zig zag from the Oct.’11 low of 1074.77 is shown unfolding into a five wave expanding-impulse sequence, subdividing into primary degree, 1-2-3-4-5. Wave 1 completed at 1292.66 and was followed by wave 2 declines to 1158.67. Subsequent wave 3 advances are in progress, subdividing into a visible (1)-(2)-(3)-(4)-(5) sequence of intermediate degree. Ultimate upside objectives for cycle wave C are projected to 2239.02 by a fib. 161.8% extension of the initial 1-2-1 sequence (1074.77-1422.38).
