Cycles
by m.tamosauskas| November 22, 2013 | No Comments
This weekly chart that depicts the larger upswing from the March ’09 low of 666.79 has been incorporated because it emphasizes the cyclic structure of the S&P’s price action. Especially a 62- and a 65-week cycle have been of great value during the last four years as they coincided with important tops. The interesting observation is that both the 62- and 65-week cycle indicate a high in the time band between now and mid-December.
S&P 500 weekly forecast
by m.tamosauskas| November 15, 2013 | 1 Comment
Back in the early 2011 we published this weekly S&P 500 forecast with ultimate upside target measured towards 1833.22. At that time it sounded a bit unrealistic taking into the account that S&P 500 had already made 600 points from the 2009 low. Well, now we are trading around 1790 and that translates into a 500 points advance. Now it seems like it was obvious, doesn’t it? 🙂
However, in 2012 we recognized a stronger fib. convergence at 2040 price level suggesting there is still enough upside potential left:
Even today the forecast remains the same and so far, there are no reasons to change it (of course, we will adapt to the market if it suddenly decides to do something crazy):
But the question is how do you feel now realizing that S&P 500 is headed for another 300 point boost? Sounds unrealistic as it was the case back in 2011. Momentum is obviously slowing (on a weekly basis), volume is waning, we are reaching extreme bullishness on various sentiment measurements and so on… But does it prevent from further upside continuation? Our opinion is no, unless we get a clear reversal. Quite opposite, we anticipate a panic spike up is set to follow once a healthy correction develops. A lesson to be learned – everything in the markets is possible!
A fib. 100% retracement level
by m.tamosauskas| November 8, 2013 | No Comments
One of the main Elliott Wave Theory rule says: wave 2 cannot retrace more than a fib. 100% of wave 1. It is allowed to erase all the gains/losses of wave 1 but it is not expected to create a new price extreme. The most common retracement level for wave 2 is a fib. 61.8% ratio, however, sometimes it does more, like 76.4% or 85.4%. I am pretty sure you have seen those examples in a real time trading but a 100% retracement level is really something special and rare, so it is worth to share such an example!
Yesterday DJ Utilities Average Index retraced exactly a fib. 100% of the preceding decline (510.40-467.90). The counter-trend advance from the 467.90 low is composed of three waves and is labelled a–b–c in minute degree, whilst the preceding price-swing is clearly a five wave expanding-impulse pattern. Traditional technical analysis this would describe as a double-top pattern, let’s see how this will unfold during the next several days!
Aussie$/US$ – CRB Cash Index Correlation
by m.tamosauskas| October 30, 2013 | No Comments
Commodity prices are one of the key factors in the Australian economy which combined with global growth and interest rates drives the Australian Dollar. There exists a high correlation between Aussie$/US$ and CRB cash index and by extrapolating the Elliott Wave count for one, we are a step ahead in determining the direction of the other. The base/precious metals component of the CRB-Cash index has been in a counter-trend decline since the index peaked into the May 2011 high of 370.72. The Aussie$/US$ peaked a few months later – in July ’13 at 1.1083. As can be seen, the correlation is not 100% accurate with allowance for a few weeks/months of delay in the larger directional trend changes. The clearest examples of negative divergence between these contracts can be found during the bottoming process in late ‘08/early ’09 and the topping process of May-July ’11. But eventually, the larger trend changes synchronise.
Our latest Elliott Wave analysis shows that the Aussie$/US$ has completed the entirety of its counter-trend decline that began from the July ’11 high into the August ’13 low of 0.8848 whilst the CRB-Cash index retains downside targets towards 472.51 during the next couple of months – this would then create another negative divergence prior to both synchronising in an accelerative advance that begins the last phase of the ‘inflation-pop’.
(The wave labelling for the Aussie$/US$ is shown in today’s EW-Compass report under specially featured bonus chart).
Forecast 2014
by m.tamosauskas| October 29, 2013 | No Comments
We would like to announce that finally the latest video release of WaveTrack International’s medium-term wave counts have been completed and are now available for viewing. This is a preview of price-forecasts for 2014 and is complimentary with your current EW-Compass subscription. We’ve listened to what you wanted – to view the larger patterns that are presented each week in the EW-Compass reports, and we’ve also added a lot more composite cycles as a guide in ‘timing’ some of the major trend changes for next year. The long and medium-term cycles for the S&P 500 update those originally shown in last year’s video, but we’ve also added similar periodicities for commodities, currencies and interest rates. A new monthly composite cycle for the S&P 500 provides a fascinating route-map for ending the ‘inflation-pop’ scenario – also, cycles have been created for the CRB-Cash index, Gold, Silver, Crude Oil – and for currencies, the US$ dollar index, the Euro/US$ and US$/Yen – for interest rates, the US30yr yield, US10yr yield and Europe’s DE10yr yield – it all forms an amazing picture of what lies around the corner. The presentation includes 60 charts – too big for one video so it comes in two parts – Part I takes a look at trends for global Stock Indices, Part II for Commodities, Currencies & Interest Rates. Part I is available now, Part II will be released during the next week or two. Part I provides a refresher of the ‘Shock-Pop-Drop’ scenario depicting the 18 year bear market for stock indices together with a progress report of price development within the second phase, the ‘inflation-pop’. The video will be uploaded into the ‘video’ tab located in the ‘text’ section of the ‘main-view’ area of the EW-Compass software. Become an EW-Compass report subscriber to see this video, if you already are – don’t hesitate to pass the word around that these forecasts are now available! All the best, WaveTrack analyst team.
Eurostoxx 50
by m.tamosauskas| October 25, 2013 | No Comments

This week lets take a look at European market. By perfectly trading into original upside objectives at 3058.72, the Eurostoxx has set the stage for a reversal from current levels. This would confirm the completion of the entire leading-contracting diagonal that dates back to the 2011 low of 1935.89 and set the stage for a larger decline in the months ahead. Interim downside support is measured to 2744.45 and ultimate targets to 2567.38, the fib. 38.2% retracement.
S&P 500
by m.tamosauskas| October 18, 2013 | No Comments

The S&P is now approaching ultimate upside objectives to 1740.00+/-. The probability of a reversal from there is deemed very high. An important indication is the price behaviour of European stocks which – formerly outperforming – have been showing signs of waning momentum for the last days. A reversal from 1740.00+/- would prompt a sustained decline in the months ahead, with ultimate downside measured to 1540.00+/-. Failure to reverse from 1740.00+/- could extend upside to the upper boundary line of the ending-diagonal that measures to 1750.00+/-.
S&P 500 Updated
by m.tamosauskas| October 11, 2013 | No Comments
Intermediate wave (3) that began from the June ’12 low of 1266.74 is shown unfolding into a five wave expanding-impulse sequence, subdividing into minor degree, i-ii-iii-iv-v. In this ‘preferential’ count, wave iii. is shown to have completed at the May ’13 high of 1687.18 followed by wave iv. to 1560.33. Subsequent wave v. is taking the shape of an ending-expanding diagonal pattern – upside targets are measured to 1740.00+/- by a fib. 61.8% extension of the finalising 4-5-4-5 sequence.
One more push up?
by m.tamosauskas| October 4, 2013 | No Comments
One of our Elliott Wave counts on S&P 500 allows a higher high to trade prior a decline towards 1540.00+/-. This is also suggested by a short-term BUY signal on VIX:
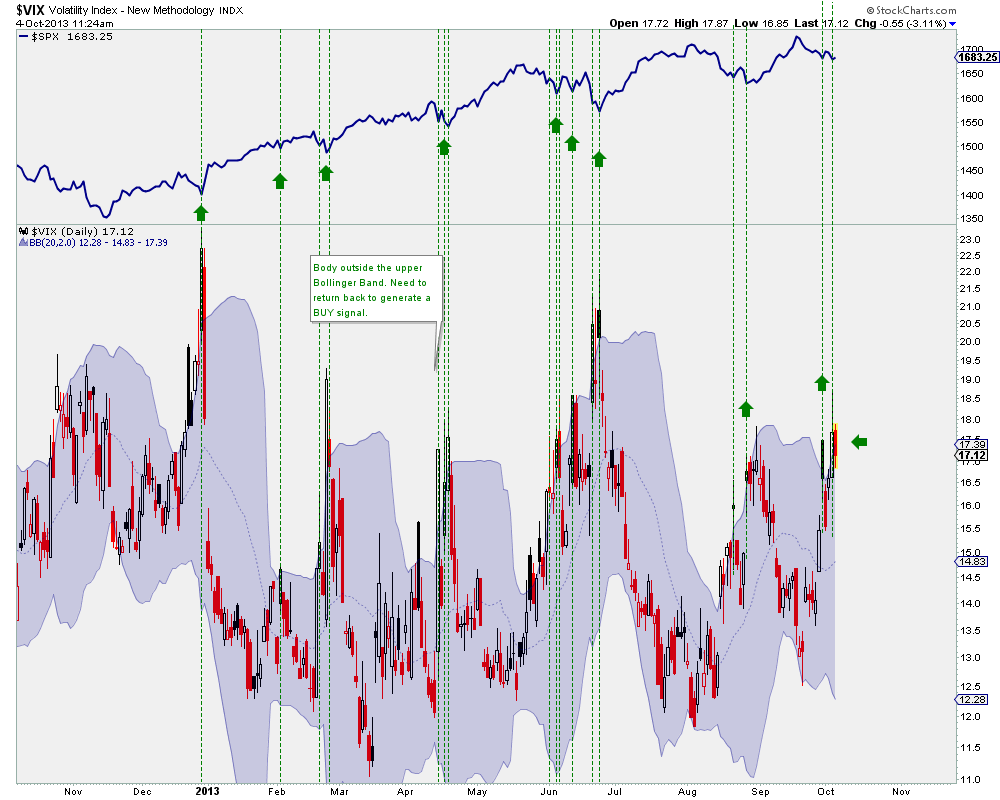
However, more and more weakness can be found around other global stock indices, especially Asia.
Just a reminder, the latest market commentary (updated twice a week and absolutely for free) including all asset classes can be found in front of our main website: https://www.wavetrack.com/
(Become an EW-Compass report subscriber and see how this pattern continues to develop and what’s coming up in the larger time-series).
Alcoa
by m.tamosauskas| September 27, 2013 | No Comments
We’d have announced our new bonus programme for the EW-Compass report. At the end of each month, an additional Elliott Wave chart will be added to the report selected from our institutional EW-Forecast database. This may highlight a current theme or chosen to corroborate the prevailing trend of any stock index, equity, bond, currency or commodity, but its primary essence will be to illustrate the pattern’s adherence to the application of fib-price-ratios. These are integral in the attempt to count Elliott Waves correctly, in an objective way and without random subjectivity that is the result of human pre-conception.
From the beginning of October, U.S. companies will report their 3rd quarter results as the earnings season kicks in! Alcoa Inc. traditionally starts the roll-call and so we’ve decided to add this equity to begin the bonus programme in order to get an impression of its trend and to see if it has any relationship to the underlying market.
We hope you enjoy this new bonus chart – please don’t forget to send us your comments as we continue to explore the inherent geometric ratio and proportion qualities contained within the Elliott Wave Principle!
(Become an EW-Compass report subscriber to see full analysis for this equity)

Recent Posts
Recent Comments
Archives
- February 2026
- December 2025
- August 2025
- July 2025
- June 2025
- March 2025
- February 2025
- January 2025
- December 2024
- August 2024
- July 2024
- June 2024
- May 2024
- April 2024
- February 2024
- January 2024
- December 2023
- August 2023
- July 2023
- June 2023
- March 2023
- February 2023
- January 2023
- December 2022
- November 2022
- October 2022
- August 2022
- July 2022
- June 2022
- May 2022
- March 2022
- February 2022
- January 2022
- December 2021
- August 2021
- July 2021
- June 2021
- March 2021
- February 2021
- January 2021
- December 2020
- November 2020
- August 2020
- July 2020
- June 2020
- May 2020
- April 2020
- March 2020
- February 2020
- January 2020
- December 2019
- October 2019
- September 2019
- July 2019
- June 2019
- May 2019
- April 2019
- March 2019
- February 2019
- January 2019
- December 2018
- November 2018
- September 2018
- August 2018
- July 2018
- June 2018
- May 2018
- April 2018
- March 2018
- February 2018
- January 2018
- December 2017
- November 2017
- October 2017
- September 2017
- August 2017
- July 2017
- June 2017
- May 2017
- March 2017
- February 2017
- January 2017
- December 2016
- November 2016
- October 2016
- September 2016
- August 2016
- July 2016
- June 2016
- May 2016
- April 2016
- March 2016
- February 2016
- January 2016
- December 2015
- November 2015
- October 2015
- September 2015
- August 2015
- July 2015
- June 2015
- May 2015
- April 2015
- March 2015
- February 2015
- January 2015
- December 2014
- November 2014
- October 2014
- September 2014
- August 2014
- July 2014
- June 2014
- May 2014
- April 2014
- March 2014
- February 2014
- January 2014
- December 2013
- November 2013
- October 2013
- September 2013
- August 2013
- July 2013
- June 2013
- May 2013
- April 2013
- March 2013
- February 2013
- January 2013
- December 2012
- November 2012
- October 2012
- September 2012
- August 2012
Categories
- ADXY Index
- Agnico Eagle Mines
- AI Artificial Intelligence
- Alcoa
- Amazon
- AngloGold Ashanti
- Antofagasta
- APPL
- Apple
- ASX 200
- AUD vs USD
- AUDNZD
- AUDUSD
- Australia ASX 200
- Baltic Dry Index
- Banking
- Base Metals
- Biotechnology
- Bitcoin
- Bovespa
- Broadcom
- Catalexit
- central banks
- Christmas
- Commodities
- Commodities Video Outlook 2020
- Conference
- Copper
- Coronavirus Sell-Off
- CRB
- Crude oil
- crude oil price chart
- CryptoCurrency
- Currencies
- Currencies + Interest Rates Video Outlook
- Cycles
- Dax 30
- deutsche bank
- Dewey Cycle
- DJ Transportation Average
- DJ Utilities
- Dow Jones 30
- Dow Theory
- ECB
- economy
- Elliott Wave
- Elliott Wave Charts
- Elliott Wave Patterns
- Elliott Wave Principle
- Emerging Markets
- Ending-Diagonal Elliott Wave Pattern
- Equity
- EUR vs CHF
- EUR/USD
- Euro / US$
- Eurostoxx 50
- EuroStoxx50
- EuroStoxxBanks
- EURUSD
- Expanding Flat Pattern
- FAAMG
- FANG+
- fib-price-ratio
- Fibonacci Trading
- Fibonacci-Price-Ratio
- Financial Forecasting
- Fixed Income
- forex
- Freeport McMoran
- FTSE 100
- Fund Management
- FX
- FXStreet
- GBP/AUD
- GBP/USD
- GDX
- GDXJ
- Germany 10 year Euro Bund future
- Gilead Sciences
- Glencore
- Global Economy
- Gold
- Gold Mining
- Golden Ratio
- goldman sachs
- Google Inc.
- Google/Alphabeth
- Greek debt crisis
- Hang Seng
- Harbinger
- Hungarian Forint
- IBEX 35 Index Spain
- Independent Research
- India-CNX Nifty 50
- Interest Rates
- Interview
- IRP Independent Research
- kbw bank index
- Lonmin
- MAG-7
- McDonald's
- MID-YEAR VIDEO UPDATE!
- Mifid II
- Mines
- Mining
- MSCI China
- MSCI Emerging Markets
- Nasdaq 100
- Nasdaq Biotechnology Index
- Nasdaq Composite
- Nasdaq100
- Netflix
- Newmont Mining
- Nikkei 225
- NVIDIA
- NYSE Composite Index
- Palladium
- Platinum
- Precious Metals
- Ralph Nelson Elliott
- Reversal-Signature
- Russell 2000
- Russia RTS
- S&P 500
- Sector
- Secular-Bull
- Sentiment Survey
- Shanghai Composite Index
- Silver
- Slanting Flat Elliott Wave Pattern
- SP100
- SP400 Mid-Cap
- SP500
- SPX 500
- STLG/AUD
- Stlg/US$
- STLG/USD
- STLG/YEN
- STLG/ZAR
- Stock Index
- Stock Index Tracking
- Stock Index Video
- Stock Indices
- Stock Indices Video Outlook 2023
- Stock Indices Video Outlook 2025
- Sugar
- Summary
- Tesla
- Tesla Inc
- Toyota
- Track Record
- trading
- Trusts
- Tutorial
- Uncategorized
- UniCredit
- US
- US Dollar Index (DXY) (USDX)
- US$ Index
- US-Dollar Index
- US10yrYields
- USD
- USD/ARS
- USD/CNY
- USD/IDR
- USD/INR
- USD/MXN
- USD/SGD
- USD/THB
- USD/YEN
- USD/ZAR
- Vale
- Value Line Index
- video
- VIDEO OUTLOOK 2018
- VIDEO OUTLOOK 2020
- VIX
- W.D. Gann
- WaveTrack International
- XAU Gold/Silver Index
- Xetra Dax
- XOP
- Yields
- Zig Zag
- Zinc
- ‘INFLATION-POP’
- ‘SHOCK-POP-DROP’