Bullish on gold? You might be too late!
by m.tamosauskas| July 14, 2014 | No Comments
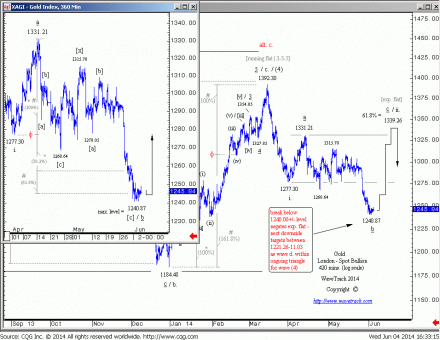
We also have been bullish on gold, but that’s now one-month-old news… Here is what EW-Compass report was suggesting on 4th of June: ‘Although gold’s decline from the April high of 1331.21 has unfolded to current levels into a seven price-swing formation, as a double zig zag however, it must now immediately begin a reversal advance to confirm its completion. Should prices hold the 1240.00+/- level and begin trading back above 1260.00+/-, then a continuation higher is forecast to complete towards 1339.26 ending minor wave ii. as an expanding flat.’ Since this forecast has been published, gold prices advanced about 100.00 US dollars per ounce, but thats not all!
Today we have a reversal signature from the main resistance level around 1340.00+/- with gold prices already trading around 20.00+/- US dollars downwards. The downtrend is expected to continue during the next few months. Don’t miss the next opportunity! Become an EW-Compass report subscriber and see how this pattern continues to develop and what’s coming up in the larger time-series!
The Russell’s 2000 decline unfolds into a five wave seqence
by m.tamosauskas| July 11, 2014 | 3 Comments
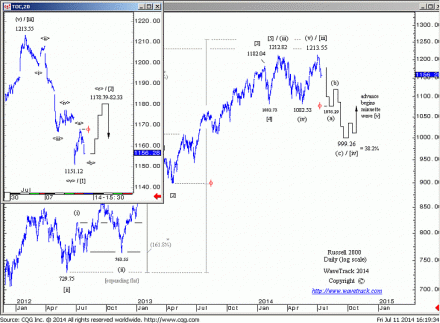
The advance from the mid-May low of 1082.53 clearly subdivides into a five wave pattern into the recent high at 1213.55 that marks the conclusion of the larger five wave impulse pattern that began from the June ’12 low. Furthermore, the subsequent decline from 1213.55 has unfolded into a clearly visible five wave expanding-impulse pattern to Thursday’s low at 1151.12. This increases the probability that a multi-month downside correction is underway (see main chart). A shorter-term counter-trend rally has begun from 1151.12 with immediate upside targets measuring towards 1178.79-82.33. This could be exceeded if an initial zig zag pattern extends as a double, in which case, an attempt towards 1200.00+/- would be tested before an accelerative decline resumes. Even though European indices are recovering and ultimately expecting higher highs during the next week or so, the Russell is unlikely to trade back above its 1213.55 high.
PowerShares DB Agriculture Fund ETF
by m.tamosauskas| July 2, 2014 | No Comments
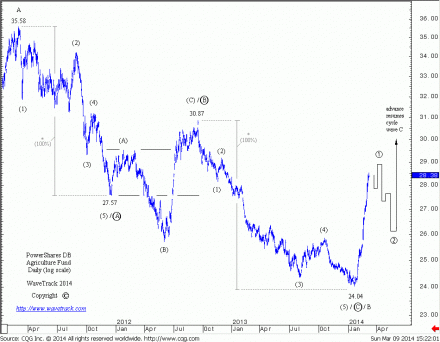
Back in early March ’14, the PowerShares DB Agriculture Fund was close to a five wave expanding-impulse pattern completion from the 24.04 low. We published this forecast (in EW-Compass report, dated 3rd of March) with an intension that once this pattern is completed, the following counter-trend decline must follow that most commonly unfolds into a three wave pattern:
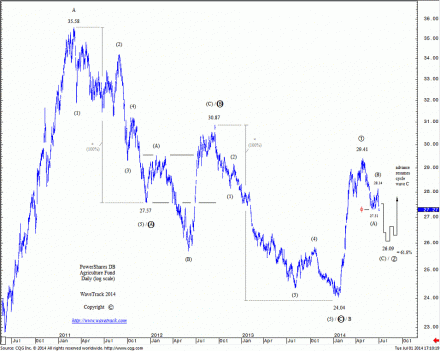
An updated chart shows the first five wave sequence as primary wave 1 has completed into the 29.41 high and the following counter-trend decline began primary wave 2. This is expected to unfold into a single zig zag pattern, labelled (A)-(B)-(C) in intermediate degree with ultimate downside targets measured towards 26.09 – a convergence level with a fib. 61.8% extension ratio of wave (A) and a fib.61.8% retracement level of the preceding advance (24.04-29.41). This should act as a magnet but once this support level has been tested, look for a reversal signature to resume the larger advances.
It promises to be an exciting moment, because this is part of our ‘inflation-pop’ scenario and we see evidence of this already with agricultural commodities breaking above their long-term downtrend channels.
Facebook is set to resume it’s decline
by m.tamosauskas| June 20, 2014 | 2 Comments
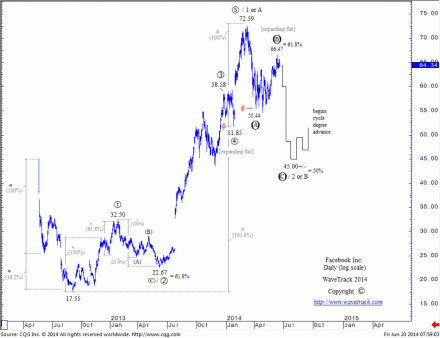
The advance from the Sep.’12 low to the March ’14 high of 72.59 unfolded into a five wave expanding-impulse pattern labelled 1-2-3-4-5 in primary degree. Extending the net advance between primary waves 1 to 4 (17.55-51.85) by a fib. 61.8% ratio we can project the high for wave 5. The actual recorded high of 72.59 was just a few cents below the ideal upside measurement which confirms the completion of a five wave pattern to the upside. Each five wave advance must be balanced by a corrective sequence and in this case the decline that began from the 72.59 high is expected to unfold into a single zig zag pattern labelled A-B-C in primary degree. Primary wave A completed the initial decline into the April ’14 low of 55.44 and the following counter-trend advance as primary wave B just ended into the recent high of 66.47. Back in early May ’14 we projected the high for this advance to 66.00+/- and this appears has been achieved. The subsequent decline began the final price-swing as primary wave C. It must unfold into a smaller five wave sequence with ultimate downside targets measured towards 45.00+/- – a fib. 50% retracement level of the preceding advance (17.55-72.59). A test to this support level is expected sometime during the next few months.
The Big Secret in Financial Markets
by m.tamosauskas| June 18, 2014 | No Comments
Dear Elliott Wave enthusiasts!
The northern hemisphere’s Summer Solstice is the opposite of the southern hemisphere’s Winter Solstice, the period of longest daylight/nightfall, scheduled for this coming Saturday, 21st June. The balancing of day/night is just one dualistic aspect of our universe and a reminder of the one which also epitomises the dualistic concept found in the Elliott Wave Principle, of action/reaction, progress/regress, trend/counter-trend – you already know this well!
You might think this is an obvious comparison, but let me tell you something – the opening sentence of R.N.Elliott’s ‘Nature’s Law’ (1946) seems a million miles away in today’s consciousness: ‘No truth meets more general acceptance than the universe is ruled by law’. Well, can you honestly say that the majority of people in finance today generally accept that the universe is ruled by law!? – the reality is quite the opposite – recent studies have shown that over 90% of professional fund managers consider fundamental statistics and relative news-flows are more important factors that drive price movement than any governing universal laws! But don’t let that fool you – break out of the herd and stay ahead.
I’ve recently returned to my birthplace, London, presenting WaveTrack’s latest Elliott Wave ‘inflation-pop’ forecasts to over 300+ delegates at BLOOMBERG’s Precious Metals Forum. It was interesting to note that most were ambivalent about the price outlook of Gold/Silver/Platinum even though it was their business! – this is not an isolated case – I’ve come across this time and time again, all over the world within major fund management companies. It’s as if the bombardment of news-flows via all the latest mobile gadgets is slowly inducing the masses into a coma!
During the last two-and-a-half years, stock markets, and particularly those of the U.S. have been trading into record highs – and following the BULLISH path outlined in WaveTrack International’s annual price forecasts for 2011 – revisit the forecast here:
https://www.wavetrack.com/reports-presentations/outlook-forecasts-2011.html
Were you able to benefit from this advance? – one aspect that returns to thoughts of ‘universal law’ is TRUST. Without trust in the analysis, how can anyone benefit from the results of a forecast that projects the S&P 500 trading higher by over by more than 700 points! Trust has to be earned, then experienced by each of us. In the 2011 annual S&P forecast, emphasis was given to another universal law, perhaps more of a universal ‘guideline’, that of Ratio and Proportion. We all know of the pattern repetition concept of the Elliott Wave Principle (EWP) but we must also learn to trust in the dimensions of those 13 patterns that R.N.Elliott discovered. Not all patterns unfold to the perfection that is playing out in the zig zag advance that started the S&P’s advance from the March ’09 lows, but the BIG SECRET is that most actually do! Now it’s time to update the S&P’s progress, and many other stock markets from around the world!
We are pleased to announce the update of medium and long-term Elliott Wave STOCK INDICES price-forecasts is now available in the latest SEMI-ANNUAL video release. This is PART I of a two-part publication and it is absolutely FREE when you subscribe to the EW-Compass report. I won’t try and convince you that it’s worth every cent because in reality, it’s true value can’t be measured – it’s worthless to the unbeliever, priceless to its dualistic counter-part!…take a look at some of our subscriber’s comments from the last video series…
https://www.wavetrack.com//testimonials.html
Familiarise yourself with many of the major markets – there are 44 chart updates together with guidance from our analysis of cycle periodicities. It all add to an intriguing look at what is likely ahead during the next several months, but also the next several years.
The main content updates stock index markets of America, Europe, Asia and Australasia but more importantly, synchronises each of the ongoing Elliott Wave price patterns into a cohesive matrix of price development – this is very different to mainstream Elliott Wave analysis that continues to publish major contradictions and discrepancies comparing forecasts for U.S. and Asian indices.
The video also describes why Asian and Emerging Market indices have underperformed during the last few years relative to the U.S. and Europe, and why it will gain ground and even outperform later this year and onwards for another 12-18 months.
To gain IMMEDIATE ACCESS to watch the video, subscribe to the EW-Compass report, open the software and in the main-menu summary page, click on the PART I, STOCK INDICES link – it’s that simple!
And don’t forget to send us your comments once you’ve watched the video – we gain so much from your feedback and sharing this with everyone will inevitably take us all forward!
All the very best to you,
Peter Goodburn
PART I, STOCK INDICES (SEMI-ANNUAL) VIDEO is NOW AVAILABLE!
by m.tamosauskas| June 17, 2014 | No Comments
We are pleased to announce the update of medium and long-term Elliott Wave STOCK INDICES price-forecasts is now available in the latest SEMI-ANNUAL video release. Subscribe to the EW-Compass report & watch the latest Stock Indices Video today! Subscribe now!
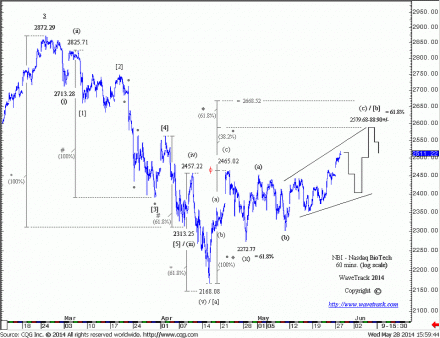
NASDAQ Biotechnology Index (NBI) is taking a more direct route to upside targets
by m.tamosauskas| June 5, 2014 | No Comments
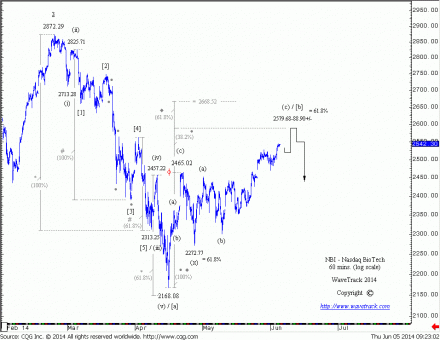
The bearish divergences visible in U.S. stock markets were first identified mid-April when the benchmark S&P 500 index declined into a three price-swing corrective pattern whilst the Nasdaq Bio-Tech (NBI) unfolded during the same period into a five wave impulse – the Elliott Wave Principle (EWP) states that three wave patterns define counter-trend movement whilst five wave patterns define directional ‘trend’.
This difference in wave structure, comparing two indices with a high positive correlation, provides a warning of larger, impending declines. Naturally, the rhythms of up-and-down price movement are synchronised, but the relative outperformance/underperformance creates different Elliott Wave patterns, each unique.
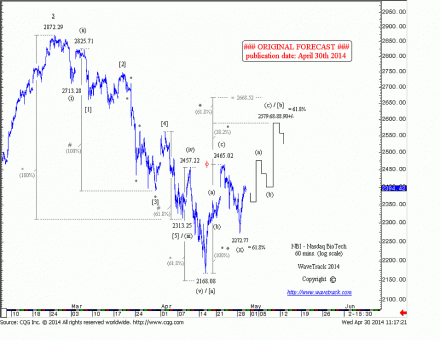
The S&P’s three wave decline into the mid-April ’14 low confirmed its uptrend remained intact, incomplete, with at least another attempt due to unfold into record highs – that has now been realised at levels of 1928.00+/-. In contrast, the Nasdaq Bio-Tech (NBI) index’s decline into a five wave pattern to the mid-April low at 2168.08 confirms it has already ended its uptrend earlier, into its late-Feb.’14 high of 2872.29 and has begun a durational 2-3 month decline. This is valuable difference because it informs us that the S&P’s advance to record highs is somewhat limited – because the Nasdaq Bio-Tech (NBI) is simply synchronising the same upswing but as a counter-trend pattern.
Copper resumes larger declines
by m.tamosauskas| June 2, 2014 | No Comments
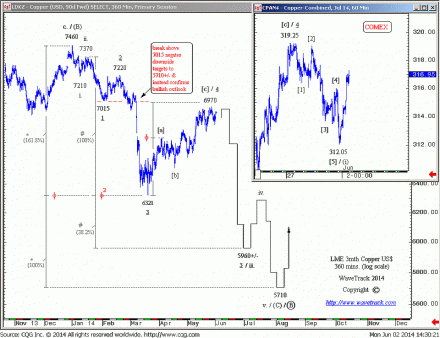
Copper has so far unfolded higher from the March ’14 low of 6321 into a three wave sequence – this has the dimensions of ending a counter-trend zig zag pattern. It was critical for prices to remain below the Elliott Wave ‘overlap’ resistance of 7015 if downside forecasts below the March low were to remain valid. So far, prices have ended the zig zag upswing below this level, at last week’s high of 6970 (319.25 – COMEX).
As if to validate a reversal signature, the subsequent decline from those highs has unfolded into an intra-hourly five wave pattern that ended into last Friday’s low at 6836 (312.05). This heightens the probability that the entire upswing from the March low has ended, and a new series of declines is about to begin, lasting the next couple of months or so, with downside targets to 5710+/-.
Only an accelerative break above the 7015 resistance would change this outlook.
Precious Metals Forum (Bloomberg)
by m.tamosauskas| June 2, 2014 | No Comments
Bloomberg hosted a Precious Metals Forum on 20th of May and we were invited to present our latest Elliott Wave price-forecasts. Mineweb.com made a proffesional review and we would like to share it: http://www.mineweb.com/mineweb/content/en/mineweb-whats-new?oid=242324&sn=Detail
NASDAQ Biotechnology Index (NBI)
by m.tamosauskas| May 28, 2014 | No Comments
A follow-up on NASDAQ Biotechnology Index (NBI). For the record: goo.gl/pKSl29
