McDonald’s Elliott Wave Update
by m.tamosauskas| September 12, 2014 | No Comments
In recent updates, the McDonald’s Corp. was described as unfolding into an expanding flat pattern that requires a lower low below 92.22 with ideal downside targets measured towards 90.65-90.58 (published on July 25, 2014):
‘The recent acceleration to the downside suggests the prolongation of the counter-trend decline that began from the April ’13 high of 103.70 whilst unfolding into an expanding flat pattern, labelled a–b–c– in minute degree with ultimate downside targets measured towards 90.65-58.
Once these downside targets have been tested, await a reversal signature to confirm the resumption of the larger uptrend with targets to new all-time highs.’
Well, this week the downside objectives were met at 90.53 and was followed by an immediate response to the upside:
This is a good example that even in oversold broader market like U.S., we can always find stocks that offer good risk/reward ratio and huge upside potential. It is worth quating the legendary trader Jones Paul Tudor: ‘I look for opportunities with tremendously skewed reward-risk opportunities. Don’t ever let them get into your pocket – that means there’s no reason to leverage substantially. There’s no reason to take substantial amounts of financial risk ever, because you should always be able to find something where you can skew the reward risk relationship so greatly in your favor that you can take a variety of small investments with great reward risk opportunities that should give you minimum draw down pain and maximum upside opportunities.’ It is not a secret that he was a big Elliott Wave enthusiast! And this theory is capable to spot such a trade setups.
This might the one!
S&P 500 daily analysis (EWT + Momentum study)
by m.tamosauskas| September 10, 2014 | No Comments
S&P 500 is topping. Yes, there are little doubts about that, the only question left is do we have one more additional upswing prior to staging the big decline or not? Last week we showed deteriorating weekly market internals, today we focus on the daily chart. Basis our preferential Elliott Wave count, the advance that began from the June ’12 low of 1266.74 is labelled as intermediate wave (3), subdividing i.-ii.-iii.-iv.-v. in minor degree. This five wave expanding-impulse pattern is obviously mature, so the risk/reward ratio is definitely in favour to the downside:

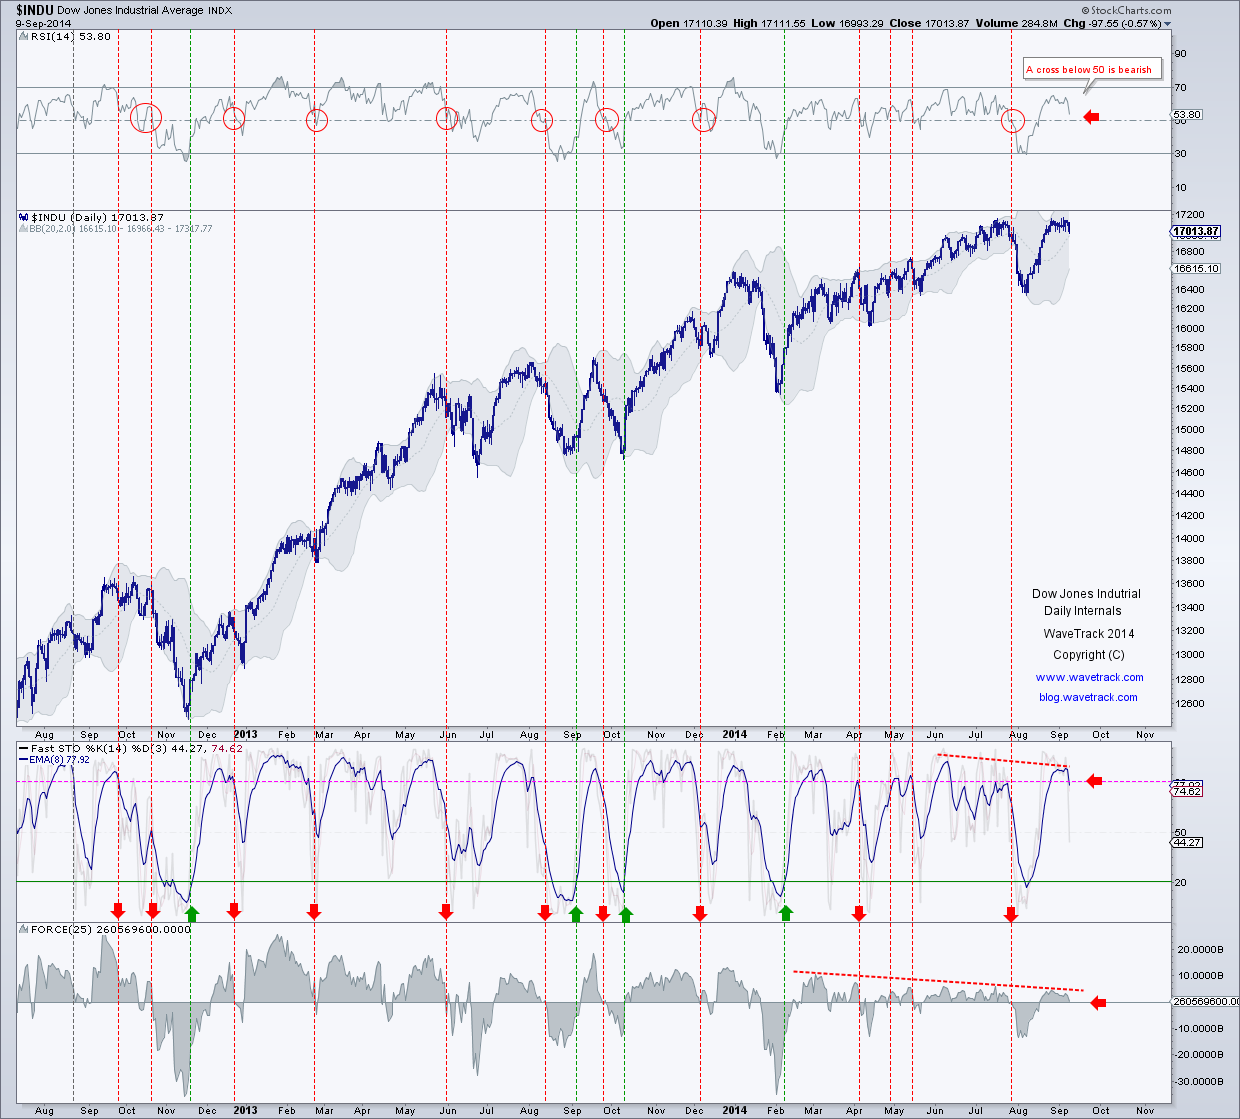
The following two charts, prepared by our team analyst who is tracking momentum studies, shows the Dow Jones Industrial is on the verge issuing a SELL signal:
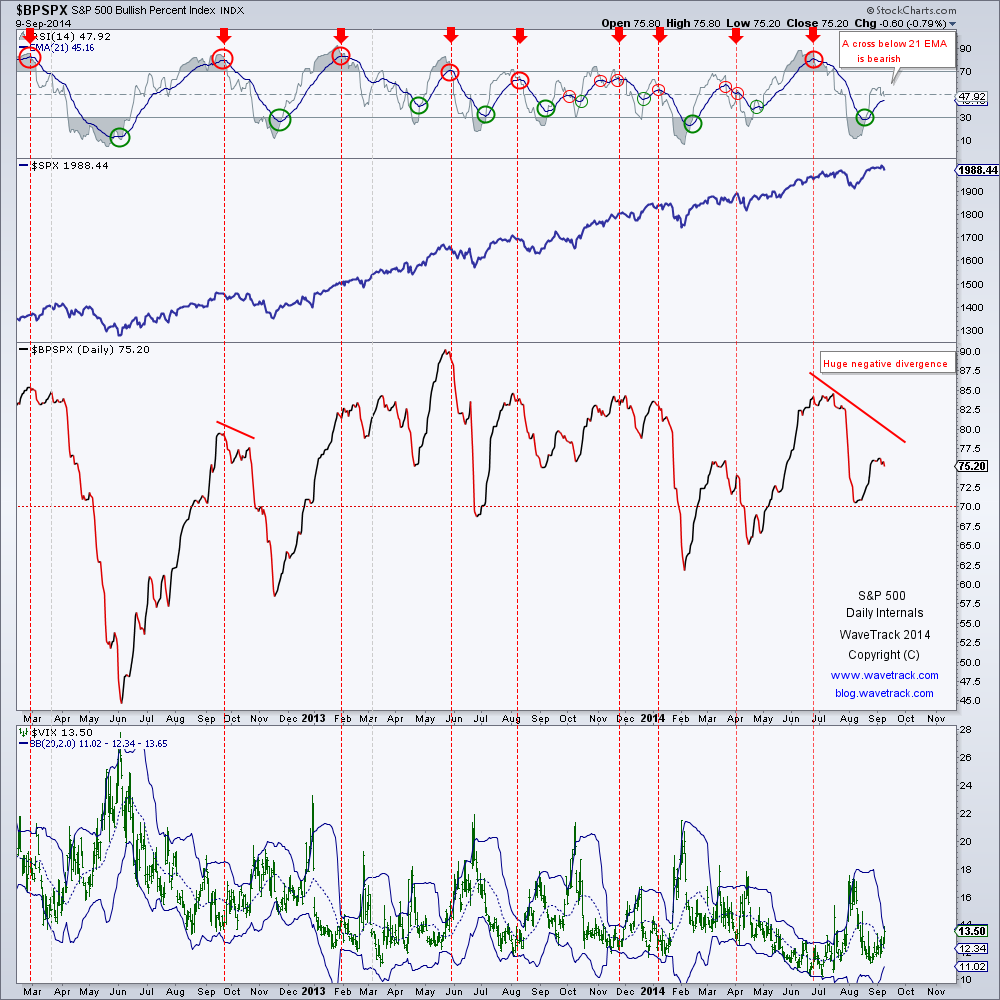
Notable development on S&P 500 Bullish % index – first, huge negative divergence between the index and the S&P 500 and second, watch the modified RSI reading – a break below its 21 EMA would issue a SELL signal also, which has been reliable in many cases:
Just a reminder, the latest market commentary (updated twice a week and absolutely for free) including all asset classes can be found in front of our main website: https://www.wavetrack.com/
(Intraday price development is updated twice per week via EW-Compass report, contact us if you would like to see an example: link)
S&P 500 weekly
by m.tamosauskas| September 3, 2014 | No Comments

The long-term momentum study of S&P 500 index shows deteriorating market internals in almost all over the place. The highest RSI reading was recorded last year in May and since when it is diverging with a rising S&P 500 index. To keep this diverging pace RSI must stay below 72.53 (the last reading peak). Next noticeable thing is a decreasing volume during the entire bull-run. A ten week moving average has been plotted to a better understanding what is going on. Lesser and lesser market participation in this game and rules don’t change for an extended period. Finally, the recent S&P 500 pullbacks have become smaller and smaller that produced a wedge shape formation. It is extremely difficult to project the ending point of this pattern but once it’s completed, one can be sure – a swift move down is the highest probability. Basis the projection in our latest EW-Compass reports, the ending point is close and the following decline is expected to be deep. Until it resolves, the trend is up and the only thing you can help yourself is controlling the risk of your portfolio.
India S&P CNX Nifty 50 Elliott Wave Update
by m.tamosauskas| August 27, 2014 | No Comments
The Nifty 50 has now achieved original upside targets at 7954.00+/- with Monday’s high of 7968.25. A reversal is necessary to confirm the completion of minor wave iii.’s advance from the Feb.’14 low of 5933.30 and validate a 4th wave counter-trend decline in the months ahead. Basis a fib. 50% retracement ratio, idealised support is measured to 6867.30 – cutting this by a fib. 61.8% ratio, we obtain interim targets to 7272.80. Seen from the larger perspective, intermediate wave (3) that dates back to the 2013 low of 5118.85 is still in progress. Thus, once idealised downside has been achieved in the months ahead, a finalising upswing towards ultimate upside at 9037.10 is forecast afterwards.
Agnico Eagle Mines: ‘Gold miners are showing a light in a tunnel’
by Peter for WaveTrack International| August 19, 2014 | No Comments
The gold and silver decline that began from the April/Sep. ’11 highs is now more than 3 years in progress. The same can be said about gold miners including our benchmark GDX (ETF) index and some of its major equity components such as Newmont Mining, Goldcorp and Barrick Res. Like the GDX, these too have experienced sharp price declines during the last few years. There’s no doubt that our ‘inflation-pop’ scenario that forecasts new record highs during the next few years remains on track although the beginning of the next upsurge is still some months away as downside targets for the GDX, XAU and their components are still some way off. That’s not the case for Agnico-Eagle Mines though!
Basis Elliott Wave analysis, the decline that began from the March ’08 high of 83.45 has taken the form of a running flat pattern, labelled a-b-c in minor degree. Note the 3-3-5 subdivision in the pattern. This is atypical of the same (running/expanding) flat patterns unfolding over the same time period for the GDX and the other mining stocks quoted earlier. The final price-swing of this pattern as minor wave c. has unfolded into an ending expanding-diagonal pattern completing into the October ’13 low of 23.77. So whilst the GDX and the other mining stock flat patterns remain incomplete, Agnico Eagle Mines has already ended its entire counter-trend movement.
The following advance has since began intermediate wave (5) that ultimately will break into new record highs. Shorter-term, the price action from the 23.77 low is shown unfolding in a step like series of 1-2-1-2 sequences – another corrective decline is expected at some stage during the next few months, synchronising with final declines for the GDX etc. One more corrective pullback will offer the last chance to step in prior to an accelerative 3rd-of-3rd wave advance!
Stock Markets begin multi-month decline
by m.tamosauskas| August 5, 2014 | No Comments
Dear Elliott Wave Enthusiasts,
Stock markets have finally staged a reversal [sell] signature late last week to confirm the S&P 500’s upside completion of intermediate wave (3) that began from the June ‘12 lows. Many of you that have followed our Elliott Wave price forecasts for the last several years will know that our last major ‘buy-signal’ of Oct.’11 exactly pinpointed the S&P’s low at 1074.77 through a combination matrix of Fibonacci-Price-Ratios (FPRs) – go back in time and see that chart and accompanying text below:
Elliott Wave Update: October 12, 2011
“The early October low at 1074.77 traded exactly to measured downside targets (at 1074.82)…other major indices such as the Dow Jones did not exhibit ‘overthrow’ and when cross-correlated to the NYSE Composite index, the depth of the final decline below the August low measures too far to be anything else other than completing a diagonal. Therefore, the structure of the decline and its overall form together with measured amplitude targets being met provide convincing evidence that a significant low has already ended the May ’11 decline”.
This marked the beginning of a multi-year advance as cycle wave C that in fact, is still working its way higher.
Now fast-forward to July 2014 – the recent high recorded the S&P 500 at 1991.39 on July 24, and this formed a ‘triple-convergence’ matrix of Fibonacci-Price-Ratios (FPRs) measuring the impulse upswing from the June ’13 low – see next chart:

Last week’s sell-off that has now traded down to 1925.00 is only the beginning of a sustained multi-month corrective decline as intermediate wave (4).
The importance of applying Fibonacci-Price-Ratios (FPRs) to the evolving Elliott Wave structure of any developing pattern is paramount in the evaluation, identification and execution of any investment strategy. Relying on an arbitrary wave labelling without applying the correct matrix overlay is like jumping out of a plane without a parachute – and how daft is that?
Mainstream Elliott Wave analysis continues its long-term perma-bear theme, as it has done for the last few years – however, the guidelines of Fibonacci-Price-Ratios (FPRs) have provided a reliable bullish outlook during the same period. Only now does this change. A period of regression has begun but the application of FPR’s within the Elliott Wave structure of the entire advance from the Oct.’11 low suggests this is simply another corrective decline that will later be followed by higher highs.
Just look at what is going on in Asian stock markets and this fact becomes realistic. Asian markets have underperformed since Oct.’11 with some yet to even break above the pre-financial-crisis highs – that will occur next year though – but first, a hefty corrective decline must unfold beforehand!
All of these global markets are updated in our twice-weekly publication of the Elliott Wave Compass report. Furthermore, we published the medium and long-term wave counts for Global Stock Markets, Currencies, Interest Rates & Commodities in our latest video series – view PART I & PART II absolutely FREE when you subscribe to the EW-Compass report.
Very best wishes,
Peter Goodburn
Senior Elliott Wave Analyst
Hungarian Forint Elliott Wave analysis
by m.tamosauskas| August 4, 2014 | No Comments
Questions from our Elliott Wave Compass subscribers form an important part of our relationship at WaveTrack International, and this is especially true when we’re asked for a ‘helping-hand’ in analysing a contract that is not so often featuring in mainstream news. In this update, we are challenged into applying the Elliott Wave Principle (EWP) to the Euro/Hungarian Forint currency pair. We hope this has a great benefit to our friends in Hungary and to those other traders in far-flung countries in other locations around the world – Peter Goodburn
Elliott Wave Analysis
The first approach in analysing anything for the first time is to identify correlations with similar contracts, especially those that are more familiar. This study began by taking a comparative look at the US$/Forint and the Euro/Rouble.
The US$/Hungarian Forint currency pair has trended higher since forming an important low in July ’08 at 143.37. The overall upswing that followed took the form of a zig zag, labelled (A)-(B)-(C) ending in March ’09 at 252.77. It is no coincidence that this effect coincided with the financial-crisis sell-off – see fig #1.
The subsequent decline could have resumed a new multi-year downtrend but it instead unfolded into a three price-swing sideways pattern that is interpreted as a horizontal flat, ending at 176.83 in May ’11 as wave (X). This suggests the initial zig zag upswing is transforming into a double zig zag. Extending the first zig zag by a fib. 38.2% ratio projects the second to 313.67.
The secondary zig zag sequence has since begun from 176.83 and corroborated by the fact that a five wave subdivision is identified in the advance to 252.00, ending wave (A). Extending this by a fib. 61.8% ratio projects wave (C) to 313.91 – note the convergence!
Notwithstanding shorter-term permutations during the next few months, what this intermediate-term wave count tells us is that the dominant direction is upwards for the next year or two.
The analysis of the Euro/ Hungarian Forint currency pair is more complex since January ’12 and especially from the Aug.’12 low of 274.44. Several short-term permutations are possible, so please do not consider this intermediate-term analysis suitable for shorter-term trading. Nonetheless, its basic structure from the July ’08 low of 228.01 is the same – see fig #2.
If the same double zig zag pattern is unfolding higher, strengthening the Euro and weakening the Forint, then more upside potential seems likely during the equivalent 1-2 year period.
Interestingly, if the first zig zag, (A)-(B)-(C) to 317.13 is extended by a fib. 38.2% ratio, an upside target for the completion of the second projects upside targets to 359.73. Basis the equivalent upside targets for the US$/Forint, this equates to a Euro/US$ level at 1.1468+/-. As our subscribers know, this is one of our intermediate-term downside targets that is derived from the Euro/US$ analysis.
Extending the first zig zag by a larger fib. 61.8% ratio, upside projections measure to 388.85 – this is equivalent to 1.2396+/- for the Euro/US$, and again, independently, this number closely approximates to current analysis.
Closing Remarks
The overall structure of these double zig zag patterns in upside progress from the July ’08 lows appears sound. They certainly corroborate our more detailed analysis for the Euro/US$ that is updated twice-weekly in the EW-Compass reports. If you’re trading currencies and would like to join us as one of our subscribers, we’ve no doubt that we can assist in achieving your goals! If you’d like to see our currency track-record, please send us a request using the ‘Help-desk’, located at www.wavetrack.com
WaveTrack International Risk Disclaimer
WaveTrack International and its related publications apply R.N.Elliott’s ‘The Wave Principle’ to historical market price activity which categorises and interprets the progress of future price patterns according to this methodology. Whilst it may be reasonable to deduce a course of action regarding investments as a result of such application, at no time or on any occasion will specific securities, futures, options or commodities of any kind be recommended for purchase or sale. Publications containing forecasts are therefore intended for information purposes only. Any opinion contained in these reports is only a statement of our views and are based on information we believe to be reliable but no guarantee is given as to its accuracy or completeness. Markets are volatile and therefore subject to rapid an unexpected price changes. Any person relying on information contained in these reports does so at their own risk entirely and no liability is accepted by WaveTrack International in respect thereof.
Tags: elliott wave > EUR/HUF > EUR/USD > Hungarian Forint > USD/HUF
Triple fib-price-ratio convergence
by m.tamosauskas| August 1, 2014 | No Comments
Back in early July, we presented a triple fib-price-ratio convergence level that proved to be a rock solid resistance. The S&P 500 index was trying to reattempt these highs several times but finally gave up and the result of all of that is a free fall decline.
Yesterday we published an interim report to all our EW-Compass subscribers stating:’ Despite yesterday’s impressive Q2 U.S. GDP figures and the latest comments from the Federal Reserve that it would maintain a highly accommodative policy stance for a considerable period after expiry of the bond-purchase programme, we see the S&P 500 breaking integral support levels below 1952.86 during the opening of today’s session. This suggests a final top is in for intermediate wave (3), ending this advance that dates back to the June ’12 low 1266.74.
Up until today’s action, there was always a chance of the S&P extending into one additional higher high as last night’s short-term update described, but the break below the early-July low of 1952.86 was significant – furthermore the pattern from the 1991.39 high displays an incomplete five wave impulse pattern in downside progress – this also negates the alternate short-term count scenario describing an expanding flat pattern that would allow one additional higher high to develop.’
As we have turned down, the fib-price-ratios will be extremely valuable tool to determine possible support levels and ending point for counter-trend advances. Become an EW-Compass report subscriber and get shorter-term insights to other stock market indices. The latest report will be published later tonight.
Don’t be misled by short ‘C’ waves! [Gold]
by m.tamosauskas| July 29, 2014 | No Comments
Last Friday’s late-session upswings for both gold & silver have delayed the downside targets for gold towards 1272.43 having tested 1287.75 even though original levels for silver were duly reached with a low recorded at 20.11.
If silver is viewed in isolation, it is possible to describe a zig zag pattern completing into last week’s low at 20.11 from the 21.60 high – that of course would suggest a more bullish outlook that points towards the alternate counts currently updated in recent weeks. But gold’s equivalent decline from its 10th July high of 1344.93 is unlikely to have completed a synchronised zig zag pattern into last week’s low at 1287.75 because wave ‘c’ of the zig zag that began its decline from 1324.77 would be ‘too short’ when compared to wave ‘a’.
It is a common misconception that ‘c’ waves within zig zag patterns [commonly] measure 61.8% of ‘a’ waves – our archived files within WaveSearch and hands-on practice over the last twenty-five years shows a much higher commonality where waves ‘a’ & ‘c’ either conform to a fib. 100% equality ratio, or where wave ‘a’ is extended by a fib. 38.2% or 61.8% ratio to depict the conclusion of wave ‘c’. Short ‘c’ waves do exist, but these occur at a significantly smaller number than manifests in the other three fib-price-ratio measurements – tip: try to avoid the temptation of labelling short ‘c’ waves within zig zags!
Another aspect worth mentioning is the fact that gold’s secondary decline between 1324.77-1287.75 can be seen unfolding into a three wave sequence, not a five as would be required to label this as wave ‘c’ of a zig zag. Together, these observations suggest gold’s decline from the 1344.93 high remains incomplete…
The interim-update report describing short-term forecast changes on gold and silver was just sent to all our EW-Compass subscribers. Not only does this bring you up-to-date with the short-term price developments but also valuable information on how the application of fib-price-ratios are used to distinguish between competing wave counts. (Become an EW-Compass report subscriber and get an immediate access to the interim Gold & Silver Update!)
Australia ASX 200 close to the critical resistance level
by m.tamosauskas| July 25, 2014 | No Comments
Additional upside has brought the ASX close to its original upside projections at 5631. These are derived basis the assumption that an expanding flat sequence is in progress from the Oct.’13 high of 5457 – a fib. 38.2% upside extension of the initial decline from there labelled minor wave a. measures to 5631 which should provide strong resistance for the current rally. A reversal is expected from there to validate wave c. declines in the months ahead. A fib. 38.2% downside extension of wave a. projects to ultimate targets at 4873 which tallies with a fib. 38.2% retracement of intermediate wave (3).
« go back — keep looking »
Recent Posts
Recent Comments
Archives
- February 2026
- December 2025
- August 2025
- July 2025
- June 2025
- March 2025
- February 2025
- January 2025
- December 2024
- August 2024
- July 2024
- June 2024
- May 2024
- April 2024
- February 2024
- January 2024
- December 2023
- August 2023
- July 2023
- June 2023
- March 2023
- February 2023
- January 2023
- December 2022
- November 2022
- October 2022
- August 2022
- July 2022
- June 2022
- May 2022
- March 2022
- February 2022
- January 2022
- December 2021
- August 2021
- July 2021
- June 2021
- March 2021
- February 2021
- January 2021
- December 2020
- November 2020
- August 2020
- July 2020
- June 2020
- May 2020
- April 2020
- March 2020
- February 2020
- January 2020
- December 2019
- October 2019
- September 2019
- July 2019
- June 2019
- May 2019
- April 2019
- March 2019
- February 2019
- January 2019
- December 2018
- November 2018
- September 2018
- August 2018
- July 2018
- June 2018
- May 2018
- April 2018
- March 2018
- February 2018
- January 2018
- December 2017
- November 2017
- October 2017
- September 2017
- August 2017
- July 2017
- June 2017
- May 2017
- March 2017
- February 2017
- January 2017
- December 2016
- November 2016
- October 2016
- September 2016
- August 2016
- July 2016
- June 2016
- May 2016
- April 2016
- March 2016
- February 2016
- January 2016
- December 2015
- November 2015
- October 2015
- September 2015
- August 2015
- July 2015
- June 2015
- May 2015
- April 2015
- March 2015
- February 2015
- January 2015
- December 2014
- November 2014
- October 2014
- September 2014
- August 2014
- July 2014
- June 2014
- May 2014
- April 2014
- March 2014
- February 2014
- January 2014
- December 2013
- November 2013
- October 2013
- September 2013
- August 2013
- July 2013
- June 2013
- May 2013
- April 2013
- March 2013
- February 2013
- January 2013
- December 2012
- November 2012
- October 2012
- September 2012
- August 2012
Categories
- ADXY Index
- Agnico Eagle Mines
- AI Artificial Intelligence
- Alcoa
- Amazon
- AngloGold Ashanti
- Antofagasta
- APPL
- Apple
- ASX 200
- AUD vs USD
- AUDNZD
- AUDUSD
- Australia ASX 200
- Baltic Dry Index
- Banking
- Base Metals
- Biotechnology
- Bitcoin
- Bovespa
- Broadcom
- Catalexit
- central banks
- Christmas
- Commodities
- Commodities Video Outlook 2020
- Conference
- Copper
- Coronavirus Sell-Off
- CRB
- Crude oil
- crude oil price chart
- CryptoCurrency
- Currencies
- Currencies + Interest Rates Video Outlook
- Cycles
- Dax 30
- deutsche bank
- Dewey Cycle
- DJ Transportation Average
- DJ Utilities
- Dow Jones 30
- Dow Theory
- ECB
- economy
- Elliott Wave
- Elliott Wave Charts
- Elliott Wave Patterns
- Elliott Wave Principle
- Emerging Markets
- Ending-Diagonal Elliott Wave Pattern
- Equity
- EUR vs CHF
- EUR/USD
- Euro / US$
- Eurostoxx 50
- EuroStoxx50
- EuroStoxxBanks
- EURUSD
- Expanding Flat Pattern
- FAAMG
- FANG+
- fib-price-ratio
- Fibonacci Trading
- Fibonacci-Price-Ratio
- Financial Forecasting
- Fixed Income
- forex
- Freeport McMoran
- FTSE 100
- Fund Management
- FX
- FXStreet
- GBP/AUD
- GBP/USD
- GDX
- GDXJ
- Germany 10 year Euro Bund future
- Gilead Sciences
- Glencore
- Global Economy
- Gold
- Gold Mining
- Golden Ratio
- goldman sachs
- Google Inc.
- Google/Alphabeth
- Greek debt crisis
- Hang Seng
- Harbinger
- Hungarian Forint
- IBEX 35 Index Spain
- Independent Research
- India-CNX Nifty 50
- Interest Rates
- Interview
- IRP Independent Research
- kbw bank index
- Lonmin
- MAG-7
- McDonald's
- MID-YEAR VIDEO UPDATE!
- Mifid II
- Mines
- Mining
- MSCI China
- MSCI Emerging Markets
- Nasdaq 100
- Nasdaq Biotechnology Index
- Nasdaq Composite
- Nasdaq100
- Netflix
- Newmont Mining
- Nikkei 225
- NVIDIA
- NYSE Composite Index
- Palladium
- Platinum
- Precious Metals
- Ralph Nelson Elliott
- Reversal-Signature
- Russell 2000
- Russia RTS
- S&P 500
- Sector
- Secular-Bull
- Sentiment Survey
- Shanghai Composite Index
- Silver
- Slanting Flat Elliott Wave Pattern
- SP100
- SP400 Mid-Cap
- SP500
- SPX 500
- STLG/AUD
- Stlg/US$
- STLG/USD
- STLG/YEN
- STLG/ZAR
- Stock Index
- Stock Index Tracking
- Stock Index Video
- Stock Indices
- Stock Indices Video Outlook 2023
- Stock Indices Video Outlook 2025
- Sugar
- Summary
- Tesla
- Tesla Inc
- Toyota
- Track Record
- trading
- Trusts
- Tutorial
- Uncategorized
- UniCredit
- US
- US Dollar Index (DXY) (USDX)
- US$ Index
- US-Dollar Index
- US10yrYields
- USD
- USD/ARS
- USD/CNY
- USD/IDR
- USD/INR
- USD/MXN
- USD/SGD
- USD/THB
- USD/YEN
- USD/ZAR
- Vale
- Value Line Index
- video
- VIDEO OUTLOOK 2018
- VIDEO OUTLOOK 2020
- VIX
- W.D. Gann
- WaveTrack International
- XAU Gold/Silver Index
- Xetra Dax
- XOP
- Yields
- Zig Zag
- Zinc
- ‘INFLATION-POP’
- ‘SHOCK-POP-DROP’