An Update of Precious Metals & the ‘Inflation-Pop’
by m.tamosauskas| November 17, 2014 | No Comments
Even though bearish precious metal forecasts have dominated the investment scene over the last several months, it was very noticeable that social media interest ‘spiked’ when gold recently broke below the 18-month horizontal lows of 1180.00+/- during the late-October sell-off. The Bank of Japan (BOJ) had just announced the expansion of its quantitative easing programme and whilst this may have inflationary implications down the road, was seen in the short-term as a bearish indication for precious metals basis a weakening global economy that needs propping up.
It was therefore no surprise when media headlines followed the break below 1180.00+/- that the latest batch of price downgrades from investment banks were announced. CNBC came through with a report that gold was now heading lower towards $800.00 oz. whilst Bank of America Merrill Lynch announced ‘Buy the US$ Dollar, Sell Gold’ adding ‘…downside targets are…potentially below (1180.00) to 1087.00 and even 956.00”.
When analysts continue downgrading price levels on a consistent basis over several months, well, that raises a red-warning flag, but when downside forecasts are suddenly lowered by large percentages, especially following a psychological breakdown as gold did below 1180.00+/-, then it signals the approach of a major low. This is of course, a ‘contrarian’ bullish signal – it won’t necessarily time the actual low for precious metals but it does provide a useful indication of pessimistic extremes, and when that is applied to the Elliott Wave count for Precious Metals, it makes a powerful statement of imminent change.
The next stage of WaveTrack International’s ‘Inflation-Pop’ scenario is set to kick-in soon – interestingly, Legal & General Investment Management (LGIM) which manages £463bn in assets recently reported that its economic model has ‘flipped’ form predicting ‘deflation’ to signalling ‘inflation’ in every major region, including the Eurozone – now that’s amazing!
In our latest monthly edition of the institutional Elliott Wave Navigator report, the medium and long-term forecasts for Gold, Silver and Platinum are updated together with updates for the GDX, XAU indices, and several major gold stocks that include Newmont Mining, GoldCorp. etc. and Silver Wheaton. This follows on from our bearish forecasts earlier this year, but the report highlights the approach to specific downside targets for gold, silver and the ETF’s. The consequences are huge as we enter this next stage, and it will also have knock-on effects for the US$ Dollar too.
This latest report is the most detailed written and reported on since our video updates were published earlier this year, and its details not only the current downside targets for Gold, Silver, Platinum and all the indices and equities, but the upside target projections for the next few years. Form this analysis, it is possible to determine what is going to outperform, and underperform during this next and final upsurge of the ‘Inflation-Pop’.
The Elliott Wave Navigator report is only available to our institutional subscribers, but this up-coming event is so important, we want to share it with you too. Just subscribe to the EW-Compass report (1x month = US$32.00, 3x months = $96.00) and get the PRECIOUS METALS report absolutely FREE as part of your subscription. Its monetary value can’t be figured, but to anyone interested in gaining a view of what the precious metals landscape looks like during the next few years, well, that would mean adding a few ‘000’s to a figure.
We hope to see you join us as our EW-Compass membership continues to grow – our community of Elliott Wave enthusiasts has a common goal and a common voice – now’s the time to express it.
(Become an EW-Compass report subscriber and see how these patterns continues to develop and what’s coming up in the larger time-series).
Tags: elliott wave > Gold > Gold Miners > Inflation-pop > Silver
Long Term Russell 2000 Forecast
by m.tamosauskas| November 13, 2014 | No Comments
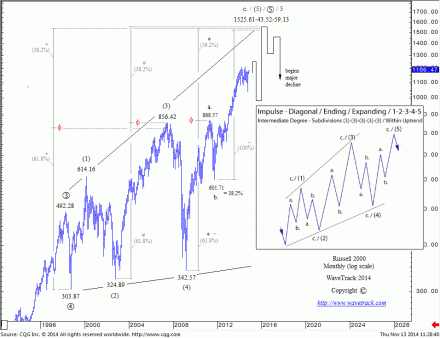
This is a powerful long-term chart basis fib-price-ratio measurements. Why? Well, it shows a quadruple convergence in a very tight price range between 1525.61-59.13 which usually attracts prices like a magnet. You won’t find many charts like that. Moreover, the advance that began from the October ’98 low of 303.87 is taking a specific Elliott Wave pattern – ending expanding-diagonal (see inset chart). This is composed of five price-swings where each of them must subdivide into smaller single/double zig zag sequences. The last price-swing within diagonal pattern began from the March ’09 low of 342.57. It is unfolding into a single zig zag pattern, labelled a.-b.-c. in minor degree. Minor wave c. so far, is clearly shorter than minor wave a. (in log scale), a fib. 100% equality ratio would be met at 1525.61. Shorter waves ‘C’ within a single zig zag pattern is an outside probability and this suggests that the current bull market that began from the 2009 lows has still enough upside potential during our ‘inflation-pop’ scenario. Interestingly, the price development of the Russell 2000 is very similar to Hang Seng and Singapore Straits Times indices. Those Asian indices are also developing into the same EW pattern from the ’98 lows.
Tags: elliott wave > Forecast > Hang Seng > Russell 2000 > Singapore Straits Times
Nikkei 225 is hitting its upside targets right now!
by m.tamosauskas| November 12, 2014 | No Comments
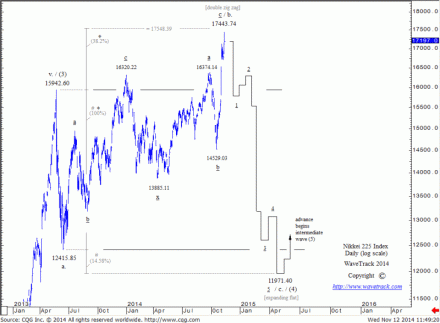
The alternate scenario outlined in the last issue has gained in probability. This is primarily due to the US$/Yen’s development – the currency pair has reached its upside objectives and is poised for an immediate reversal. Moreover, the substructure of the upswing from the mid-October low of 14529.03 can be identified as a five wave expanding-impulse pattern that exhibits idealised fib-price-ratio relationships. Finally, the fib. 38.2% upside-extension of the initial 15942.60-12415.85 decline has been approached. Taken all this evidence, there is high downside risk for the Nikkei 225 – a reversal from current levels would thus reinforce a sustained sell-off during the next months to finalise a larger expanding flat sequence labelled intermediate wave (4).
Thank You!
by m.tamosauskas| October 23, 2014 | 3 Comments
Here we go!
First of all, we would like to thank you ALL for your participation in our FREE WEEK campaign! Second, we have decided to change slightly the draw roles – two candidates are going out of our draw table because they have been the most active on our social network and definitely deserved the EW-Compass monthly subscription without any draw.
Praveen V. Shamain @praveenshamainand Giambattista Vico @alpine1300s thank you for your unstoppable support!!!
And here it goes, the other lucky EW enthusiasts were randomly chosen from our magic EW bucket 🙂
3 Facebook winners:
1. Lloyd Ames
2. Shahid Malang
3. Sasikumar Sor S Kumar
3 Twitter winners:
2. malikmehtab @mehtabmaliklive
Please send us a PM with your e-mail address. We will activate the subscription and will send you the account log-in details. Once more, all your activity in social network helps us to spread the news of WaveTrack International to as many people as possible in the Elliott Wave community.
All the best,
WaveTrack International team
FREE WEEK ends today!
by m.tamosauskas| October 22, 2014 | No Comments
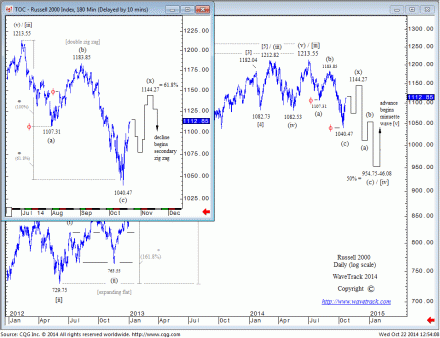
It’s been a wild week in the markets but things are clearing up. An isolated three wave decline from the 2019.26 high on S&P 500 is giving a clear message for perma-bears – the uptrend from the ’09 lows is not over! In today’s EW-Compass report we will introduce shorter-term counts for major stock indices, including the Russell 2000 which has been a very good proxy for our Elliott Wave analysis:
Don’t forget – today we end our FREE WEEK campaign but if you are a newcomer and register today, you will be able to download the latest reports for the next 7 days. And of course the last thing – by SHARING this information with your friends on Facebook or Twitter you will be included into our prize draw to win a FREE monthly EW-Compass subscription. The winners will be announced tomorrow. Thank you in your participation during this week, our teem wish you all the best!
FREE WEEK!
by m.tamosauskas| October 16, 2014 | No Comments
WaveTrack
International
Welcomes you to the Free Week of the Elliott Wave Compass Report!
This is only the second time this year that we have opened the doors to a FREE WEEK of the ELLIOTT WAVE COMPASS REPORT but the timing couldn’t be better! With our benchmark stock index, the S&P 500 trading into record highs at 2019.26 just a month ago, the picture suddenly began to change as upside targets were reached in September. This flagged a warning of an imminent top formation and an impending multi-month corrective decline set to begin – why not take a look for yourselves…
…the EW-Compass report dt. 29th September can still be download, FREE, from the archive section in the EW-Compass software – just go the menu at the top-left of the main-page and select ‘Archive & Information’ – in the list below, you can download all the recent reports, including the late-September issue that correctly forewarned our subscribers of an important inflexion point and a directional change. (TIP – if this rolls off the archive list, check out the ‘Special’ tab location in the ‘Main-View’ of the EW-Compass software).
Fast forward four weeks and the S&P 500 has declined by a massive 199.00 points, or by -9.8% per cent!
As a FREE WEEK participant, you are in a unique position to explore more of the ‘goodies’ that our regular subscribers benefit from – access to the archived reports is one way to see how we have performed, but there is more…
- ACCESS TO ARCHIVED EW-COMPASS REPORTS
- PART I VIDEO – ‘THE INFLATION-POP’ | STOCK INDICES
- ‘SPECIALS’ TAB REPORTS
Our team-head Elliott Wave analyst, Peter Goodburn has been publishing EW forecasts for over 25 years and has correctly ‘called’ many of the major price-swings of the last two decades. Towards the end of 2010, Peter identified many stock indices and commodity markets recovering from their financial-crisis lows whilst unfolding into five wave impulse patterns. That had a huge impact on the way in which asset price appreciation was to unfold in the following years. It was the PRIMARY FACTOR that led him to forecast the S&P 500 beginning another advance from the Oct.’11 low of 1074.77 with upside forecasts to 1833.22 – a massive gain of +758 points, or +70% per cent! This same five wave impulse pattern is visible in many commodities, including the key benchmark COPPER contract. This led Peter to term the ongoing advance as the ‘INFLATION-POP’ scenario and for many commodities, the next phase is due to begin in 2015. This is expected to result in a commodity upsurge that for many contracts, results in NEW RECORD HIGHS.
You have an opportunity to see how the ‘inflation-pop’ also affects some of the commodity-related stock indices, those that have underperformed during the last few years because they contained a commodity-weighted element, and we know what commodities have done in the past few years…trended downwards. But that is about to change next year.
Peter has prepared a video series to explain the ‘inflation-pop’ scenario and which stock indices will benefit the most – PART I is immediately available for viewing as part of the FREE WEEK promotion. It lasts for over an hour, and is quite detailed, so why not relax, take a cup of coffee and watch how the entire financial landscape is expected to change next year!
Another batch of ‘goodies’ can be found in the ‘Special’ reports tab, located in the main-view area of the EW-COMPASS software. These reports were added over the last couple of years and provide an amazing resource into important changes in various markets, from Emerging Markets, VIX, and Precious Metals – there is also some Elliott Wave Tutorial information that many of our subscribers have deemed to be the best around.
So there is much more to the EW-COMPASS FREE WEEK than just experiencing the latest updates of market price action – even though that has now gone into the records as the most volatile week for months! And the best bit we save ‘till last – our subscribers only pay US$32.00 per month for the report!…shss!…it’s a secret!
We hope you enjoy the experience of the EW-Compass report – and don’t forget that we are always interested in your views comments and opinions – you can do this several ways – either by sending us a message using the ‘Help Desk’ messaging board located at the top-menu of wavetrack.com homepage, or why not follow us on TWITTER, FACEBOOK? – follow us and join our illustrious group of Elliott Wave investors, traders and enthusiasts.
All the very best,
WaveTrack’s Elliott Wave Compass Team
Asia’s IRP conference
by m.tamosauskas| October 9, 2014 | No Comments
WaveTrack’s Managing Director – Peter Goodburn was invited to speak at prestigious Asia’s IRP conference presenting ‘Commodities set to surge to record highs’. We were happy to share our thoughts where Elliott Wave can see a pattern ahead which the fundamental view is just slowly starting to pick up. Most of our subscribers are familiar with our ‘inflation-pop’ scenario, but keep in touch – we have more good news soon for you all!
Toyota Motor Corp. (Elliott Wave analysis)
by m.tamosauskas| September 29, 2014 | 2 Comments
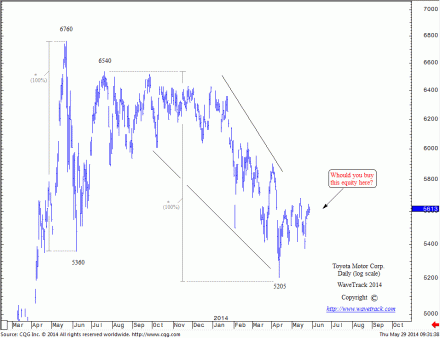
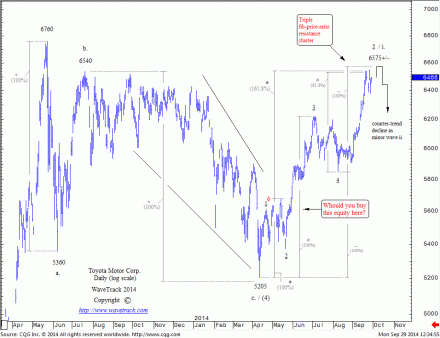
Back in May ‘2014 we showed this Toyota Motor Corp. chart with a fib. 100% equality ratio and asked you one question: would you buy this equity here? The answer was YES and we shared this trading setup with all our subscribers:
Here are the result – just few days after, this equity began an expansion phase as the third wave within a five wave expanding-impulse pattern. Now, this five wave advance is nearing its completion and moreover, the resistance level at 6575+/- shows a triple fib-price-ratio cluster. Expect a counter-trend decline as minor wave ii. to begin very soon!
EUR/USD – the low is still to come (Elliott Wave analysis)
by m.tamosauskas| September 25, 2014 | No Comments
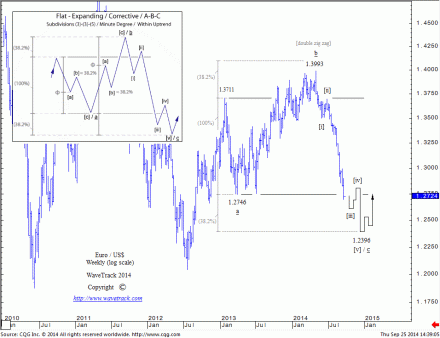
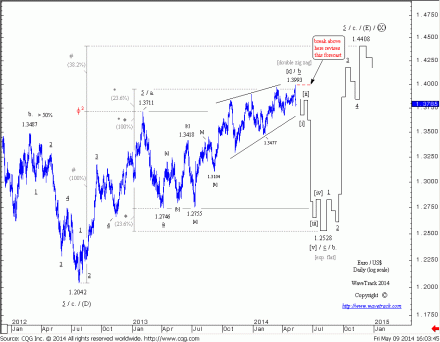
The decline that began from the January ’13 high of 1.3711 is expected to unfold into an expanding flat pattern, labelled a-b-c in minute degree. A slight adjustments were made from our original forecast dated 05/09/14:
The decline from the May ’14 high of 1.3993 must unfold into a five wave sequence that is not yet visible, suggesting the the final panic selling is yet to come!
McDonald’s Elliott Wave Update
by m.tamosauskas| September 12, 2014 | No Comments
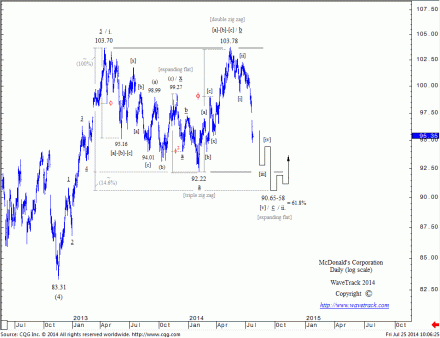
In recent updates, the McDonald’s Corp. was described as unfolding into an expanding flat pattern that requires a lower low below 92.22 with ideal downside targets measured towards 90.65-90.58 (published on July 25, 2014):
‘The recent acceleration to the downside suggests the prolongation of the counter-trend decline that began from the April ’13 high of 103.70 whilst unfolding into an expanding flat pattern, labelled a–b–c– in minute degree with ultimate downside targets measured towards 90.65-58.
Once these downside targets have been tested, await a reversal signature to confirm the resumption of the larger uptrend with targets to new all-time highs.’
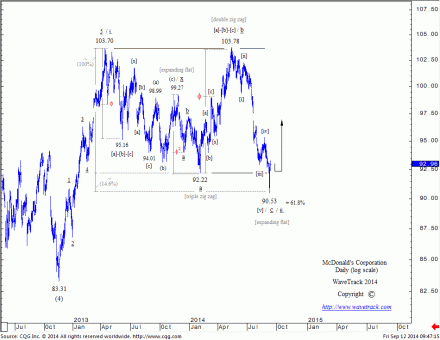
Well, this week the downside objectives were met at 90.53 and was followed by an immediate response to the upside:
This is a good example that even in oversold broader market like U.S., we can always find stocks that offer good risk/reward ratio and huge upside potential. It is worth quating the legendary trader Jones Paul Tudor: ‘I look for opportunities with tremendously skewed reward-risk opportunities. Don’t ever let them get into your pocket – that means there’s no reason to leverage substantially. There’s no reason to take substantial amounts of financial risk ever, because you should always be able to find something where you can skew the reward risk relationship so greatly in your favor that you can take a variety of small investments with great reward risk opportunities that should give you minimum draw down pain and maximum upside opportunities.’ It is not a secret that he was a big Elliott Wave enthusiast! And this theory is capable to spot such a trade setups.
This might the one!
« go back — keep looking »