USD vs YEN | Perfect Fib-Price-Ratio Harmonics!
by WaveTrack International| January 9, 2015 | No Comments
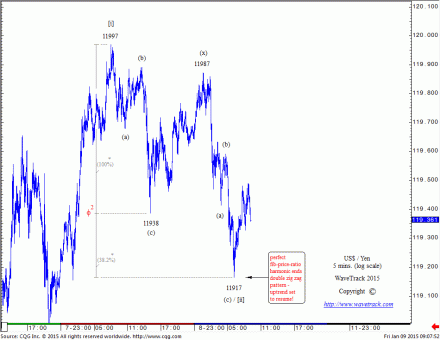
Following Tuesday’s US$/Yen’s reversal-signature from the corrective low at 11806, the larger uptrend developing from the mid-Dec.’14 low of 11556 continues higher. This next sequence of the advance from 11806 ran into short-term resistance during Thursday’s session at 11997 but the overnight sell-off into early trading Friday is again showing itself unfolding into a classical Elliott Wave corrective pattern, in this case, a double zig zag – see chart.
The double zig zag is labelled (a)-(b)-(c)-(x)-(a)-(b)-(c) and assigned sub-minuette degree according to our proprietary nomenclature, but the important aspect that defines the double zig zag is the initial three price-swings contained in the first zig zag ending at 11938 and then a deep corrective rally as wave (x) that overlaps the initial decline of wave (a). This ensures this pattern as a correction within an established uptrend and not part of a five wave impulse downtrend.
And to confirm the double zig zag pattern, from wave (x)’s high at 11987, another three wave pattern unfolded downwards, ending at 11917. Importantly, fib-price-ratio measurements confirm its completion at 11917 – one of the more common geometric ratios can be used by extending the first (a)-(b)-(c) zig zag to 11938 by a fib. 38.2% ratio – this projects to the exact low at 11917. From this, we can determine that a short-term corrective downswing has ended, with the larger/aggregate uptrend now set to resume.
Tags: USD/YEN
Nikkei-US$/Yen confirms uptrend
by WaveTrack International| January 6, 2015 | No Comments
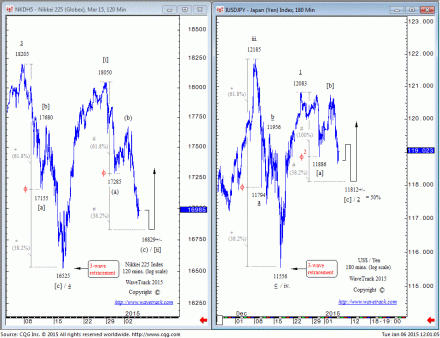
It’s no secret that there remains a positive correlation between the Nikkei stock index and the US$/Yen currency pair – see chart. But what is interesting at this time, especially when Crude Oil has again made headline news following another decline and U.S. stock markets like the S&P has given up a good proportion of its gains from the mid-December lows of 1972.53 is the fact that both the Nikkei and the US$/Yen are suggesting an uptrend is in progress.
Going back to the initial decline from the early-December highs, the Nikkei (futures) unfolded into a archetypal corrective 3-wave zig zag pattern from 18205 that ended into that mid-Dec.’14 low at 16525. This pattern is verified by using a simple fib-price-ratio measurement – extending wave [a] of the zig zag to 17155 by a fib. 61.8% ratio projects the low for wave [c] at 16525 (see inset chart, left). The extent and pattern of the
next upswing is important for two reasons – first, it has adopted a five wave subdivision (that’s bullish) – second, it breaks the interim high (wave [b] above 17680) of the preceding downswing so as to eliminate a more bearish 1-2-1-2 count from the Dec.’14 high (again, bullish). Next, the more recent decline has unfolded into another 3-wave corrective zig zag pattern that began from 18050 – extending wave (a) by a fib. 61.8% ratio projects downside targets for wave (c) to 16829+/-. This would be the idealised area to complete the correction and set the stage for the next advance to higher highs. Naturally, this bullish scenario would be negated below the mid-Dec.’14 low at 16525.The US$/Yen has unfolded into an almost identical pattern as compared to the Nikkei (see inset chart, right). A 3-wave corrective zig zag decline unfolded from the early-Dec.’14 high of 12185 ending into the mid-Dec.’14 low at 11556. Extending wave a by a fib. 61.8% ratio projects the low for wave c to 11556 – perfectly! A five wave impulse pattern followed, and again trading above the secondary retracement level of 11956 to eliminate a bearish count from the early-Dec.’14 high. The 12083 high ends the 1st wave in an ongoing five wave advance – a 2nd wave retracement has since begun labelled [a]-[b]-[c]. Extending wave [a] by a fib. 38.2% ratio projects wave [c] to 11812+/- (not quite there yet!). This converges with the fib. 50% retracement level to create hardened support. Should levels test this convergence then stage ‘price-rejection’ and then a ‘reversal signature’, then confirmation of a more sustained upswing will be triggered. This bullish outlook will only be negated below the mid-Dec.’14 low at 11556.
We are currently using these contracts as a ‘proxy’ for the other major stock markets, like the S&P to determine if the current decline from the 2093.55 high is also acting out as a 2nd wave corrective decline. If the Nikkei and US$/Yen patterns have anything to say about it, then we should expect to see an end to the current sell-off sometime during this week.
Tags: currency > fx > USD/YEN
A Very Merry Christmas & Happy New Year 2015
by WaveTrack International| December 23, 2014 | No Comments
We are pleased that you visit us and would like to take the opportunity to thank you for sharing the enthusiasm for Elliott Wave and R.N. Elliott Nature’s Law. Stay tuned in the New Year 2015 – as a lot of fascinating new insights are waiting for you. Warmest wishes to all of you from WaveTrack International’s Elliott Wave Team.
Tags: Elliott Wave Forecasting Services > financial forecasting > Merry Christmas > Natures Law > r.n. elliott > WaveTrack International
Season Greetings!
by m.tamosauskas| December 19, 2014 | 1 Comment
This coming Saturday’s edition, the 20th December ’14 will be the last Elliott Wave Compass report before the Christmas holiday festivities begin. We shall take the opportunity to rest the team a little during the following week and so the next edition will be written on Friday 2nd January ’15 for release on Saturday morning of the 3rd January.
Video Series – Part I & II – the latest long/medium-term forecasts are currently getting a complete makeover. For the last several years, the ‘inflation-pop’ upside forecasts for the S&P and most related U.S. indices have unfolded according to plan but it’s only now that targets towards 2140.00+/- are being approached. The Nasdaq has also completed a near maximum retracement of its preceding decline from those dot.com highs of March 2000 and yet, despite this, it is difficult for us to imagine a secular-bear market decline beginning from current levels – why? Well, when commodities began their synchronised recovery from the financial-crisis lows of end-Dec.’08, key economic indicators like Copper, Lead, Zinc and many other core industrial metals like Platinum unfolded higher into 2011 peaks whilst unfolding into five wave impulse patterns. Corrective patterns have since unfolded, some have ended already whilst others like crude oil are only now approaching completion. Precious metals have a different wave structure but confirm the same outcome, evident in expanding flat pattern for GDX and XAU – this signals that a very bullish upswing is set to begin in 2015. This contradiction with our original S&P forecasts from several years ago is now being addressed and will be published in the latest video series just as soon as its ready – hopefully, by early January – naturally, we’ll keep you posted on this!
And so, wherever you are, whatever your faith, we hope that your New Year will be joyous and successful – P.G.
Season’s greetings and wishing you success for 2015 – Peter Goodburn, Kamil, Martynas and most important of all, our diligent Support Team members!
Preparing for a year-end video update! (II)
by m.tamosauskas| December 18, 2014 | No Comments
The year-end is knocking on the door and we are preparing our annual video update of medium/long-term Elliott Wave forecasts for institutional clients and EW-Compass subscribers. Publication release is scheduled over the New Year. We can promise a few surprises this year with some new medium/long-term counts introduced that we haven’t shown in the past. As always, the update will include many global stock market indices, currencies, interest rates and probably the most important asset class for 2015, commodities! The main theme under discussion is the approach of upside targets for U.S. stock indices initially forecast over 4-years ago – and its relationship to the upcoming 2nd phase of the ‘inflation-pop’ for commodities – also, how do these asset classes fit together and what trends will dominate during the next few years? In the meantime, you are welcome to review some extracts from the previous video update:
Tags: elliott wave > Elliott Wave Forecasting Services > video
India CNX Nifty 50 Elliott Wave update
by m.tamosauskas| December 17, 2014 | 1 Comment
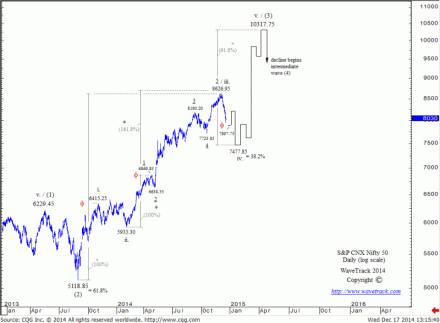
Engaged in a 4th wave within the larger five wave expanding-impulse sequence, the Nifty 50 is now approaching interim support towards 7897.75+/- that is derived by a fib. 61.8% ‘golden-section’ cut of the entire anticipated 8626.95-7477.85 range. An intra-hourly reversal is required to initiate a temporary rally for (minute) wave b within minor wave iv. prior to continuation lower during the next several weeks ahead. For the time being, ultimate downside towards 7477.85 can be maintained but should the Nifty accelerate below the interim support at 7897.75+/-, it would be indicative of a deeper decline for minor wave iv. – a fib. 50% retracement measures to 7154.10+/-.
Tags: Elliott Wave analysis > India-CNX Nifty 50
Crude Oil Elliott Wave Update
by m.tamosauskas| December 11, 2014 | No Comments
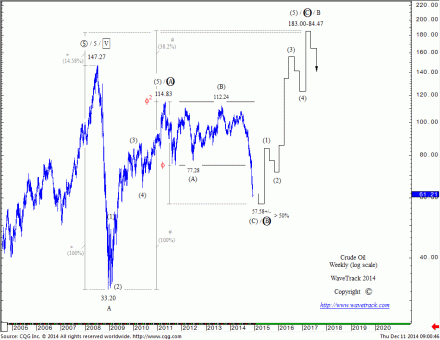
Crude Oil prices are stretching lower during the last week adding to recent accelerated declines that began from June’s secondary highs. By every measure, prices are now in a state of being oversold with sellers reacting to higher stockpiles and production levels from OPEC remaining unchanged. But within the context of the preceding upswing that began from the Dec.’08 low of 33.20 ending into the May ’11 high of 114.83, this current decline represents the balancing corrective phase, a necessary action that unfolds as the precursor to the next growth period, or literally, the next advance. Downside targets can vary in such conditions of balancing corrections but commonly adhere to price-measurements derived from the Fibonacci summation series. In this case, since first levels at 63.68+/- have just been exceeded slightly, the next support is at 57.58+/-. This is derived by extending the first sequence of the decline that unfolded into the Oct.’11 low at 74.95 by a Fibonacci 61.8% ratio. The second phase of the ‘inflation-pop’ therefore remains on schedule with ultimate upside price targets remaining unchanged towards 183.00-84.47+/-.
Copper and Gold are nearing completion and it might be that synchronised lows will deviate slightly by a couple of months. But this would not have any latent effect of changing the up-coming effect of the ‘inflation-pop’.
‘Inflation-pop’ Update
In our ‘inflation-pop’ series of articles, we have cooperated with the renowned economist Gail Fosler of the GFG LLC advisory company (New York). You can read more about the economic demographics and implications of WaveTrack International’s inflation-pop scenario in her latest posts here:
http://www.gailfosler.com/interview-peter-goodburn
Tags: Commodities > elliott wave patterns
Preparing for a year-end video update!
by m.tamosauskas| December 10, 2014 | No Comments
The year-end is knocking on the door and we are preparing our annual video update of medium/long-term Elliott Wave forecasts for institutional clients and EW-Compass subscribers. Publication release is scheduled over the New Year. We can promise a few surprises this year with some new medium/long-term counts introduced that we haven’t shown in the past. As always, the update will include many global stock market indices, currencies, interest rates and probably the most important asset class for 2015, commodities! The main theme under discussion is the approach of upside targets for U.S. stock indices initially forecast over 4-years ago – and its relationship to the upcoming 2nd phase of the ‘inflation-pop’ for commodities – also, how do these asset classes fit together and what trends will dominate during the next few years? In the meantime, you are welcome to review some extracts from the previous video update:
Apple Elliott Wave Update
by m.tamosauskas| November 26, 2014 | No Comments
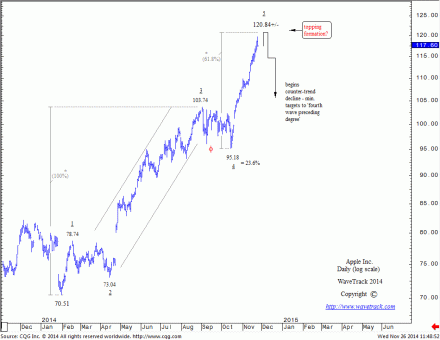
In the latest update, Apple was described as advancing into a five wave expanding-impulse pattern in minute degree from the Jan.’14 low of 70.51. There are two most common fib-price-ratio measurements within an impulse advance: a fib. 61.8% extension and a fib. 61.8% correlative ratios. By extending the net advance of minutes wave 1 to 4 (70.51-95.18) by a fib. 61.8% an upside objective was measured to 114.50+/-. This price level has been already exceeded so the natural outcome is to use higher projections by using a fib. 61.8% correlative ratio between the net advance of waves 1 to 3 (70.51-103.74) and wave 5 to 120.84+/-. Yesterday’s high at 119.75 was close enough to this resistance level and the ‘general shape’ of this five wave advance looks mature.
Commodity Prices Can’t Go Up Before They Go Down Even More: An Interview With Peter Goodburn
by m.tamosauskas| November 24, 2014 | No Comments
Dear Elliott Wave enthusiasts,
At specific times in the development of an uptrend, the Elliott Wave analyst will find themselves in a ‘contrarian’ position to the underlying economic fundamentals that have given support at various stages of a bull market. This is also true in a downtrend, a bear market. This point of contrarianism for example, occurs at the termination level of a five wave impulse pattern – the ‘deterministic’ concept of price-predictability is the foundation of the Elliott Wave Principle (EWP) that builds from Nature’s Law. And so when a five wave impulse pattern is approaching termination, the EW analyst is forewarned to expect a sudden directional change. This most often ‘leads’ the fundamental news-flow but at other times, it is timed to some significant exogenous event that triggers the directional change. We don’t always know what the specific event will be, except that something, somewhere will suddenly emerge to qualify what we can already see developing, changing from the completion of an Elliott five wave pattern.
Economics is not always seen as a good mix with the concepts of the Elliott Wave Principle because they seem to be opposite philosophies – the EWP is developed around the qualities of non-linear alternation models of growth/decay, progress/regress within a hierarchical seamless development of patterns that are both fractal and geometrical – whereas economists attempt to gain an understanding of the same phenomenon, price trends, through studies of production, distribution and the consumption of good and services. But as we have witnessed during the last several years, especially following the financial-crisis sell-off and the subsequent efforts of Central Banks to stimulate the global economies through relaxed monetary policies, it is imperative the EW analyst pays attention to what is actually happening to the fundamental news flow and understanding how this interacts with the wave patterns that evolve.
Finding your way through the labyrinth of economic data or fundamental opinion is an almost impossible task to differentiate the good from the bad. My philosophy is always this – search for the best and when there is a good flow, go with it. Now I’d like to introduce you to an economist of excellence, Gail Fosler. Gail was the former president of the U.S. Conference Board and was instrumental in developing and distributing Leading Economic Indicators from the U.S. Department of Commerce. The Wall Street Journal twice named Gail as America’s most accurate economic forecaster and she has since established her own economic consultancy, advising governments and business leaders alike.
During the last few years, I’ve had the privilege of discussing a whole array of financial topics with Gail and even though we both come from very different financial philosophies, amazingly we found common ground and mostly because we wanted to listen, learn and develop with an open mind. I’ve written about various topics related to the ‘Inflation-Pop’ over the last few years, and Gail has kindly published through her network of contacts and on her website. And now, we’d like to share some latest insights on this same subject with you. Gail interviewed me recently so that we can update the ‘inflation-pop’ and how this will specifically affect commodity prices during the next few years. The article is clear and concise in Gail’s easy language which is a great credit to her for distilling the complex into something we mere mortals can understand. So take a look at the interview now…click on the links below to read the article and see a few newly update Elliott Wave counts. And while you’re at it, take advantage of reading some of her other material – you won’t regret it.
http://www.gailfosler.com/interview-peter-goodburn
All the very best,
Peter Goodburn
« go back — keep looking »