Precious Metals fast approaching Final Lows
by m.tamosauskas| March 27, 2015 | No Comments
Dear Elliott Wave Enthusiast!
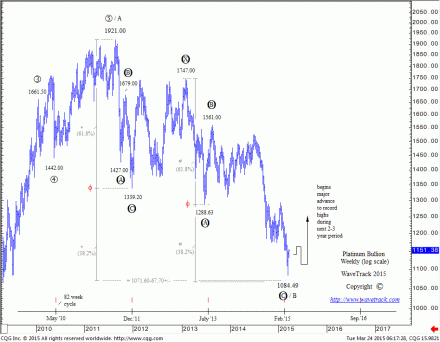
It’s three months on from the last Special Update Alert! published in January when some of the mining stocks began to break key resistance levels that confirmed a major reversal-signature had taken place. Since that time, underlying precious metals, gold and silver stalled into late-January peaks, subsequently working lower again although it was noticeable that the mining stocks were outperforming during the same period. In the case of Newmont Mining, one of our archetype stocks that is being tracked in this current phase, continued higher for several weeks even when gold and silver were already staging another sequence of declines. This type of bullish divergence is commonplace when a major low is being approached.
This creates a special trading opportunity in the precious metals sector and WaveTrack’s Precious Metals & Mining Stocks report will prepare you for some big price moves!
Find out WHY:
- Platinum’s perfect fib-price-ratios will have huge implications in the next bull market for precious metals.
- Gold is still heading down to lower lows but is soon approaching final downside target levels.
- GDX and XAU are developing identical expanding flat patterns that began in 2007/08 are also hitting major lows.
This Special Report on Precious Metals & Mining Stocks is a part of our Institutional client service with a value of USD 240.00 but we’d like to share this information with you as it is a unique and important trading/investment opportunity.
Simply subscribe to the EW-Compass report and download the report under the ‘SPECIALS TAB’ within the online version of the EW-Compass ‘main-view’ area.
AngloGold Ashanti Elliott Wave Update
by m.tamosauskas| February 14, 2015 | No Comments
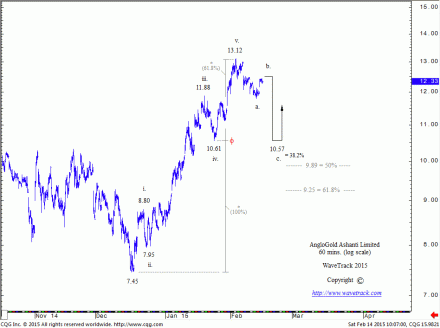
AngloGold Ashanti is already up +65% from its December ’15 low of 7.45 – one of the best performing gold mining stocks we are monitoring. The advance from this low has clearly unfolded into a five wave expanding-impulse pattern, labelled i.-ii.-iii.-iv.-v. in minor degree. Moreover, our fib-price-ratio analysis confirms this view: extending the net advance of waves i. to iii. (7.45-10.61) by a fib. 61.8% ratio, the ideal measured high for minor wave v. was at 13.08 whilst the actual high was recorded at 13.12. All of this is suggesting the directional change to the upside. Shorter-term, the counter-trend decline from the 13.12 high is currently in progress with minimum downside objectives measured towards 10.57+/- – a fib. 38.2% retracement level of the preceding advance. Once tested, a reversal signature to the upside would confirm the resumption of the larger advance. The next surge higher is expected to be larger than the initial advance (7.45-13.12), so stay tuned, the ‘inflation-pop’ scenario is on the corner!
Tags: AngloGold Ashanti > elliott wave > Gold
Precious Metals: Gold/Silver Analysts Way Too Bearish!
by WaveTrack International| February 3, 2015 | No Comments
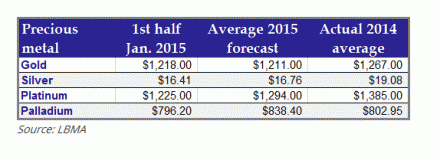
Ahead of the LBMA (London Bullion Markets Association) Assaying & Refining conference to be held in London on the 8th-10th March, the LBMA announced the submissions from 35 global analysts for their average price forecasts for gold and silver for the year 2015.
As can be seen from the above averages taken from all 35 submissions, there is a ‘herding’ mentality to predict average prices not too far from current levels. For example the average expected price for gold is $1211.00 whereas the current price is trading at $1275.00 – not too far away given prices have swung much farther already during the last month alone. Silver averages at $16.76, a price level that even traded last Friday. This is not much of a forecast – we might as well pack up and go home!
That said, the high/low average that some predicted for gold fluctuates from the most bullish at $1321.00 to the most bearish at $950.00. For silver, the high/low average of forecasts range between $18.56 as the highest and $13.00 as the lowest. These huge differences of opinion is something that you would not expect to see given that fundamental drivers must surely be the same for everyone!
Elliott Wave: from our own perspective, looking ahead for this year, 2015, we expect much higher price levels than all of these analysts. This is because Elliott Wave patterns that have taken several years to develop have reached terminal downside levels last November/December. This is particularly true for most of the gold/silver mining stocks.
We have issued various updates that confirm new medium-term uptrends have begun for the major mining companies in recent monthly reports. For example, the XME GOLD/Silver index hit into our downside targets last November ’14 with the following advance already up +30.90% per cent!
Special reports can also be downloaded FREE and are located in the ‘SPECIALS’ tab of the Elliott Wave Compass report.
You can subscribe using the link below and GET IMMEDIATE ACCESS!
Subscribe now to the EW-Compass report.
Commodity Price Turn Ahead? Interview by Gail Fosler
by WaveTrack International| January 27, 2015 | No Comments
NEWS ALERT | INTERVIEW by the Gail Fosler Group
In a recent interview with Peter Goodburn by Gail Fosler important questions were raised
Why could there be a major turn in Commodity markets?
What impact this has for the global economy?
Have central banks adopted policies of fostering inflation?
Read more here http://goo.gl/BqpYbk
About the Gail Fosler Group:
Gail D. Fosler is president and economic visionary, The GailFosler Group LLC, a strategic advisory service for global business leaders and public policymakers. The GailFosler Group provides in-depth analysis of economic, financial and public policy issues and creates new concepts and frameworks for business and government leaders to support successful decision making.
Fosler is former president and trustee of The Conference Board, and is a member of The Conference Board’s Global Advisory Council. Fosler served as president of The Conference Board from October 2007 to December 2009. From 1989-2008, she served as chief economist. In 2004, she assumed responsibility as executive vice president for expanding the international presence and operations of The Conference Board. Read more here http://goo.gl/ruXQUD
Tags: Commodities > copper > crude oil > elliott wave > gail fosler > Gold > trading
A huge test for EUR/USD is coming fast!
by m.tamosauskas| January 25, 2015 | No Comments
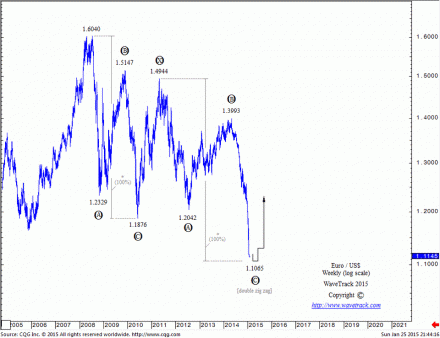
Syriza wins Greek election and EUR/USD tumbles down in the fastest pace since the July ’08 high of 1.6040. However, a seven-year decline is clearly overlapping and every Elliott Wave enthusiast should notice that it is composed of seven price-swings – a common characteristic of a counter-trend sequence. A fib-price-ratio analysis suggests a real test of this decline will come very soon at 1.1065 price level. This is derived by using a fib. 100% equality ratio between the initial three wave decline (1.6040-1.1876) and the secondary three wave decline that began from the May ’11 high of 1.4944. A reversal signature to the upside from this support level would confirm the completion of a double zig zag pattern, labelled A-B-C-X-A-B-C in primary degree. Stay tuned!
Tags: elliott wave > Greece > Syriza
ANNOUNCEMENT – PART II – VIDEO LAUNCH for Commodities & Currencies!
by m.tamosauskas| January 22, 2015 | No Comments
Tags: Commodities > Elliott Wave analysis > EW-Compass
Reliance Communications (India)
by m.tamosauskas| January 19, 2015 | No Comments
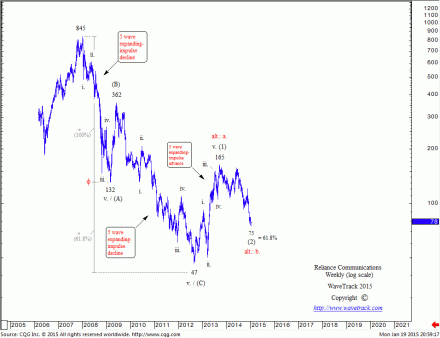
Basis fib-price-ratio analysis, the decline from the Jan.’08 high of 845 to the Aug.’12 low of 47 has unfolded into a single zig zag pattern, labelled (A)-(B)-(C) in intermediate degree. Since the price history for this equity is limited, the following advance may have begun a new bull market with upside targets to record highs or the balancing phase of the preceding decline as wave ‘X’. In both scenarios the mid-term outlook for this equity looks bullish with a high probability of trading above 165 in the months ahead.
Tags: India > NSE > Reliance Communications
Crude Oil | 5 Waves Up! – Confirms Upside Momentum
by WaveTrack International| January 16, 2015 | No Comments
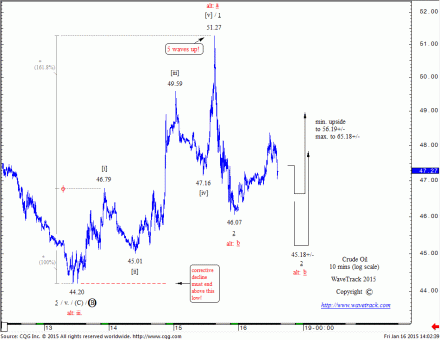
For the first time in several months, Crude Oil has staged a five wave impulse upswing from a residual low, in this case, from the 44.20 level traded last Tuesday. This confirms a meaningful reversal-signature has occurred with upside continuity assured during the next several trading days to next levels at minimum 56.19+/- or max. 65.18+/-.
This five wave pattern has perfect Elliott Wave pattern integrity complying with archetypal guidelines – it subdivides into a 5-3-5-3-5 sequence, wave [ii] two does not break below the origin of wave [i] one, wave [iii] three is the longest of the impulse waves, and wave [v] concludes above the price-extremity of wave [iii] three. Furthermore, geometric fib-price-ratios corroborate the identification of the five wave pattern where minuette wave [i] one is extended by a fib. 161.8% ratio to project the terminal high for wave [v] to 51.27 – this was an exact attempt that stopped any further upside progress, inducing a corrective sell-off to follow.
The Elliott Wave Principle states that the corrective decline cannot break below the origin of the preceding impulse that began from 44.20 and so there is now an excellent risk-reward set-up given prices have already retraced down to 46.07.
EUR vs CHF | Time to let go!
by WaveTrack International| January 15, 2015 | No Comments
The Swiss National Bank (SNB) has just announced it is abandoning the Swiss Franc’s peg to the Euro. This was originally planned over 3-years ago in order to shield the Swiss economy from the Sovereign Debt Crisis in Europe.
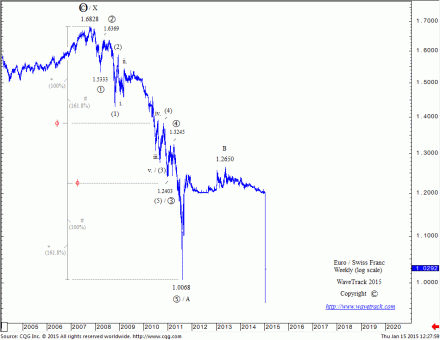
In early morning trading, the Euro has plunged lower from levels beforehand at 1.2000 to a low at 0.9608 – see chart. The SNB concluded that “enforcing and maintaining the minimum exchange rate for the Swiss franc against the euro is no longer justified”.
The Elliott Wave count describes a long-term triple zig zag decline in downside progress from the October year-1939 highs of 3.499. What you see in this chart is the third and final zig zag sequence beginning from the Oct.’07 high of 1.6828. Cycle wave A ended a five wave impulse decline into the August ’11 low at 1.0068 just prior to the SNB stepping in to begin the weakening of the Swiss Franc. Note the double ‘golden-section’ levels marked with the red phi symbols at the high of intermediate wave (4) and the low of wave (5) – these are standard fib-price-ratio measurements that define the ultimate downside target levels that ended primary wave 5 at 1.0068.
Later, wave B ended counter-trend rallies into the May ’13 high at 1.2650. The gradual decline since has been the precursor to today’s collapse as part of cycle wave C. As we project out for the next few years, ultimate downside targets measure towards 0.7411-0.7329 but this is not expected to be tested until late year-2019.
2015 FORECAST VIDEO has just been released!
by m.tamosauskas| January 12, 2015 | 2 Comments
Stock Indices (PART I) – Original S&P upside forecasts published October 2009 and updated in July 2012 forecast levels higher by +87% – those numbers are now being tested! In this video, you will discover:
- how this EW pattern and forecast was constructed
- why the Elliott Wave count was so accurate and
- why current levels have reached a decisive crossroad for 2015 and beyond
The next phase of WaveTrack’s ‘Inflation-Pop’ is set to begin for other asset classes, but in this video, you will discover some amazing price-forecasts for U.S., European and Asian stock markets – how they interact and what price levels we can expect to see during the next year and beyond! This video is a ‘must see’ in terms of Elliott Wave because it will slice through mainstream misconceptions and give you a precise guide for what to expect during the next few years – let our Track Record speak for itself!
Subscribe to the Elliott Wave Compass report and view the video absolutely FREE!
P.S. Part II will be published soon – Commodities & Currencies
Tags: Elliott wave video update 2015

