The Twilight Zone for Stock Indices (Secular-Bear vs. Secular-Bull)
by m.tamosauskas| June 5, 2015 | 2 Comments
MID-YEAR (2015) ELLIOTT WAVE VIDEO UPDATE of GLOBAL MARKETS
Dear Elliott Wave Enthusiast!
We’ve begun to compile many of the medium/long-term Elliott Wave counts from the institutional EW-Forecast database to create two 70-90 minute videos – PART I is updating trends for global STOCK INDICES, PART II for COMMODITIES, CURRENCIES & INTEREST RATES.
We’re pleased to announce this next installment, PART I, STOCK INDICES is available, NOW!
Global Stock markets have entered the ‘Twilight Zone’! Remember the TV series of the early 1960’s & ‘80’s? The twilight zone is an anthology series depicting strange, weird fantasy themes of science fiction but always with an unexpected twist at the end. Its purpose was to take you to an ‘in-between’ place of existence, a place where natural laws are held in suspension, to illustrate what is perhaps possible before time rolls ever forward.
Well, such a time exists right now – GLOBAL STOCK MARKETS have entered the TWILIGHT ZONE where it is shown what has existed, what is existing and the different possibilities it has for the FUTURE! Intuitively, we all feel like that at least once in our lives, entering a point of decision-making that sets the course for the next phase of our lives – well, stock markets will also have to make that same decision – and NOW!
There’s no shortage of opinion on analyst forecasts – many secular-bears (mainstream Elliott Wave included) hold to the idea that a major SECULAR-BEAR downtrend is about to begin whilst the flip-side of this is really coming from major institutional analysts, the perennial-bulls maintaining the SECULAR-BULL uptrend theme. But the big question is this – how to differentiate these views into a realistic approach for us to trust in?
The first and foremost thing is to remove pre-conception from any analysis – take away those obstacles that prevent us from seeing clearly – try to remain objective – that’s a good beginning, but not enough to gain a glimpse into the future. But in our latest video series, we’ll be using WaveTrack International’s unique proprietary methods of geometric Fibonacci-Price-Ratio matrices to cut through the illusionary aspects of Elliott Wave and allow it to show its true course and direction.
After all, that’s exactly what we did over 6-years ago! – original S&P upside forecasts published October 2009 and updated in July 2012 forecast levels higher by +87% – those numbers are now being tested!
In this latest 6-month video update of GLOBAL STOCK INDICES, you’ll discover:
- how the original forecasts were constructed and what they mean for today’s levels
- why the current period forms a ‘Price & Time’ continuum – the ‘TWILIGHT ZONE’
- how to differentiate between a SECULAR-BEAR and a SECULAR-BULL
Simply subscribe to the EW-Compass report to get IMMEDIATE ACCESS to the STOCK INDICES VIDEO!
P.S. PART II – Commodities, Currencies & Interest Rates will be published next month! (we’re working on it!)
Aussie $ / New Zealand $ (Elliott Wave Update)
by m.tamosauskas| June 2, 2015 | No Comments
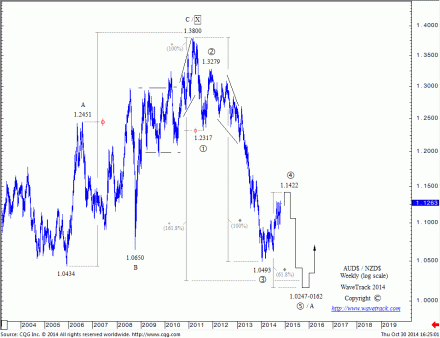
Back in October ’14 we advocated that Aussie$ / New Zealand$ is about to begin the final sell-off within a larger decline that began from the March ’11 high of 1.3800. This downswing was expected to unfold into a five wave expanding-impulse pattern, labelled 1-2-3-4-5 in primary degree with ultimate downside objectives measured towards 1.0247-0162:
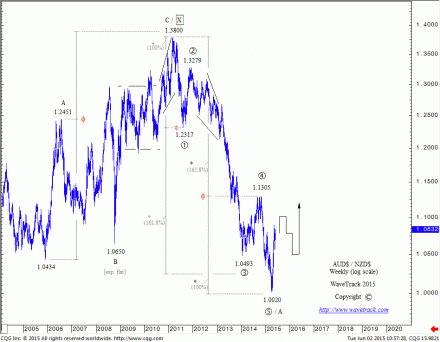
The downside targets were measured by using a fib. 61.8% correlation ratio between the net decline of waves 1 to 3 and wave 5. This is our common Elliott Wave fib-price-ratio for expanding-impulse patterns. Without it, it would be difficult to measure such an accurate support level, which after some months, turns out to be the exact outcome:
Prices responded precisely with a recorded low at 1.0020 in April ’15 and the following price rejection to the upside suggests a multi-year decline has completed into this low!
Elliott Wave pattern of the month (US$ Index)
by m.tamosauskas| May 22, 2015 | No Comments
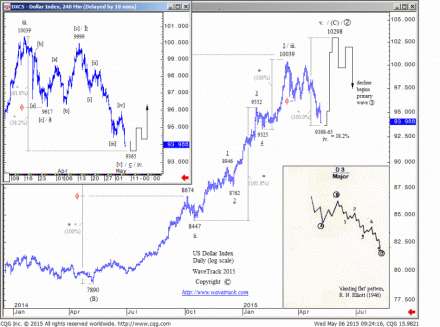
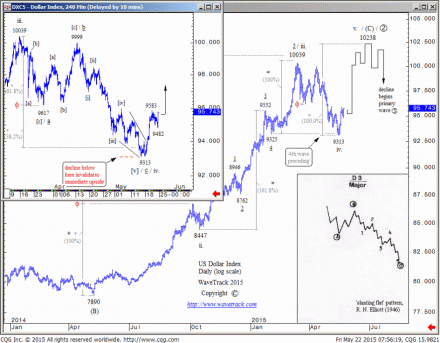
This month, we monitored a rare pattern that was described by R. N. Elliott himself in 1946. It is a variation of the standard flat sequence that is characterised by a 3-3-5 subdivision of its three price swings. The important difference to a ‘standard’ horizontal flat is that the ‘b’ wave of the pattern falls short of the beginning of the ‘a’ wave but the ‘c’ wave exceeds the beginning of wave ‘b’. This produces a ‘slanting’ appearance.
We spotted this pattern in the US$ index as it declined from its March high of 100.39 into a low of 96.17 in a three wave manner. This was followed by a three price swing advance to 99.99. For an Elliott Wave practitioner, this would have implied a double zig zag decline from 100.39 but the accelerative decline from 99.99 clearly showed the characteristics of a five wave impulse sequence. Therefore, the ‘slanting flat’ was adopted in our 6th of May issue that showed an idealised completion level to 93.65 based off a fib. 61.8% extension of the initial three price-swing decline to 96.17.
During the last several trading days, this target was approached and the US$ began a multi-day reversal. Although it dipped slightly lower, this was still in line with the larger outlook – the entire downswing from 100.39 pinpointed the area of ‘4th preceding’ at 9325+/-, an important retracement level for impulse waves. Now, the US$ index has verified the reversal and is poised for continued upside in the weeks ahead.
Would you sell it here? (Toyota Motor Corp. Elliott Wave analysis)
by m.tamosauskas| May 14, 2015 | No Comments
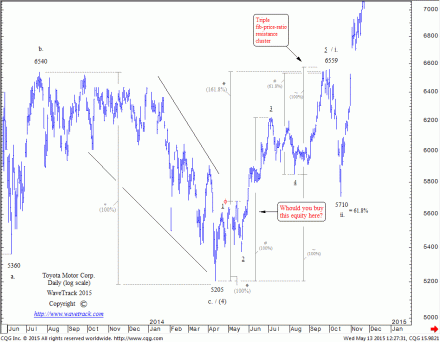
Last year we were asking “Would you buy it here?”: http://blog.wavetrack.com/toyota-motor-corp-elliott-wave-analysis/. Soon enough, Toyota Motor Corp. staged an upside reversal signature and the following advance unfolded into a five wave expanding-impulse pattern with completion into the Oct.’14 high of 6559. Remember the triple fib-price-ratio resistance level near 6550? This was almost the exact level there prices stopped advancing and began the 2nd wave balancing process:
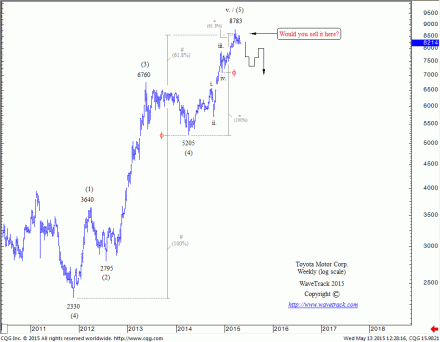
The second wave ended near the fib. 61.8% retracement level setting up the stage for an accelerative wave 3 to begin. The gapping-up price development confirmed this forecast. Today the entire five wave sequence in minor degree is shown has completed into the recent high of 8783:
Again, it was easy to forecast basis two converging fib-price-ratio measurements that provided a strong resistance. Now we asking another question: “Would you sell it here?”. Our Elliott Wave analysis suggests the risk is huge for a larger decline beginning very soon.
Lonmin PLC begins its final stage of a multi-year bear market
by m.tamosauskas| May 10, 2015 | 1 Comment
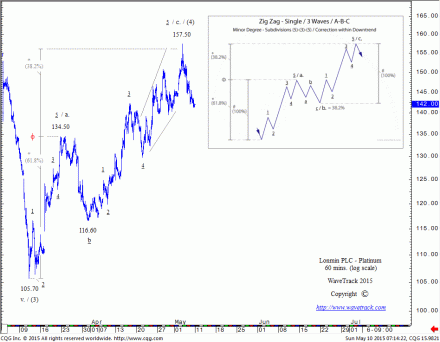
Lonmin, the third-largest platinum miner by output, is struggling with its business since precious metals remain in their bear markets. Platinum is at its lowest price in almost six years. Investments cuts, workface layoffs and strikes become a new normal in this sector. However, one should keep in mind that precious metals are in their final bear-market phase and looking further ahead, our ‘inflation-pop’ scenario should dramatically change the situation in a mining sector. The Lonmin is expected to stage a final sell-off during the next few months prior to beginning the new bull market. Basis Elliott Wave analysis, the advance that began from the March ’15 low of 105.70 unfolded into a single zig zag pattern, labelled a.-b.-c. in minor degree with a completion into the recent high of 157.50. Note a fib. 61.8%/38.2% ratio within a single zig zag pattern. The recent spike and an immediate reversal to the downside suggest the final sell-off has already begun from the 157.50 high:
S&P 500 – Join the ‘Being There’ moment in Financial History!
by WaveTrack International| May 4, 2015 | No Comments
Have you wondered what direction the S&P is unfolding into lately? Since the late-March low formed at 2045.50, the index has traded to new record highs but it’s not been a straightforward advance – quite the contrary in fact! ‘Volatility’ seems to be a more accurate description of its upward progress as each advance is followed by vicious pullbacks – these are so sharp and deep that you wonder whether a new downtrend is about to kick-in?
If you’ve been trading the short side of the market during this time, you’ve most likely jumped in and out several times to the point of exhaustion, exasperation%#! But wait!…in these seemingly chaotic price moves lies perfect geometric symmetry. Using a combination of Elliott Wave pattern identification and Fibonacci-Price-Ratio matrices we’ve unravelled the intricacies of each wave sequence since the advance began and moulded them into a clear and concise forecast of ongoing price development! No more guessing – this forecast is a ‘must-see’.
It’s a ‘must-see’ because it probably comes at one of the most important junctures in financial history. Witnessing this next sequence of the stock market is akin to ‘being there’ when it happened, and you’ll be telling the story to your friends for a long time to come.
These recent movements of the S&P are not only completing the final Elliott Wave patterns from the March lows, not even the five wave impulse sequences from the Oct.’14 lows, but larger, three wave patterns from the March ’09 lows. That makes it special.
If you want to see how each of these ‘three’ time-series are threaded together, then log-in immediately to your EW-Compass subscription and view our latest ‘Week Ahead’ video. In there, you’ll be able to watch Peter Goodburn’s latest take of the S&P’s recent activity, how it is likely to progress over the next two/three week period and how it integrates into the larger patterns forming from the Oct.’14 and March ’09 lows.
A major turning point is coming up and you really must be prepared. The three time-series of the S&P are supplemented with an updated look at last year’s 91 month (7.58 year) cycle – also, there are updates and commentary for the Dow Jones (DJIA), Nasdaq 100, Eurostoxx 50, Xetra Dax, Shanghai Composite, Nifty 50, Nikkei, ASX 200, US$ index, Euro/US$, Stlg/US$, US$/Yen, US10yr yield, De10yr yield, Gold, Silver, Crude oil and Brent oil.
Make sure your subscription is up-to-date – or click here to renew!
All the very best,
WaveTrack’s Elliott Wave Team
P.S. the video streams for 25-minutes – enjoy!
Betroleo Brasileiro price doubles within a month!
by m.tamosauskas| April 28, 2015 | No Comments
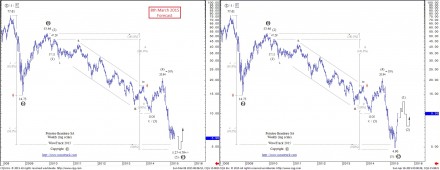
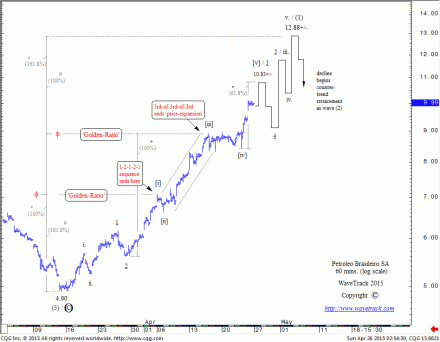
Two months ago we published Petroleo Brasileiro forecast calling for a major bottom to develop during the next few weeks. Two downside targets were measured basis our fib-price-ratio analysis and as it stands out the bottom was found near the lower range of it with a recorded low at 4.90. The following rejection to the upside and an immediate price-doubling are suggesting the completion of a 7-year counter-trend decline into this low. Step by step the ‘inflation-pop’ scenario is starting its course and commodity related assets, just like Petroleo Brasileiro, are expected to benefit the most:
Short-term, the advance that began from the 4.90 low is taking a form of a five wave pattern, labelled as intermediate wave (1). A test towards 12.88+/- is expected during the next several weeks prior to beginning the balancing phase of the preceding advance (4.90-12.88+/-):
Keep in touch, we have much more to show! Or better – subscribe to the EW-Compass report to see how the ‘inflation-pop’ scenario is expected to develop in other asset classes.
AUDUSD – testing an important support level!
by m.tamosauskas| April 22, 2015 | No Comments
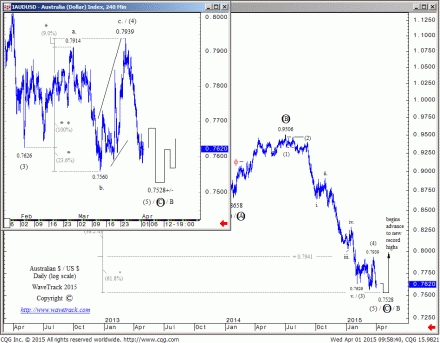
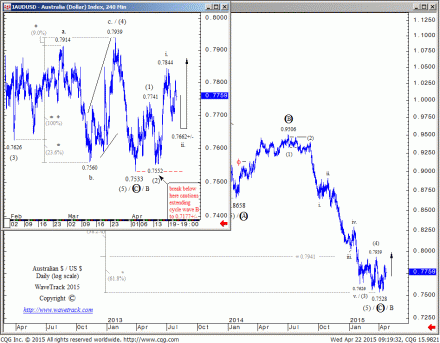
In the last weeks, we witnessed a spectacular bottoming formation on the AUD/US$. The currency pair staged a nice expanding flat before pinpointing its long-term downside objective that was measured by our fib-price-ratio measurements. The following strong price rejection once again has proved the validity of these measurements. There is now a high probability that the AUD/US$ could have completed a multi-year decline:
New IRP Journal – Independent Research at its best
by WaveTrack International| April 13, 2015 | No Comments
ANNOUNCEMENT | NEW IRP JOURNAL |
To all our Subscribers, Club/Registrant members and Twitter/Facebook followers, we are pleased to announce WaveTrack International’s latest article published in the inaugural edition of the Independent Research Provider’s magazine. Issue 1/Volume 1 for April 2015 is hot off the press and you can read our article and others right now with this FREE complimentary download – just click on the link below:
Furthermore, if you are interested in receiving the online-magazine each month, you can sign up for FREE, using this link:
Ensure that you insert your contact details into the correct category – for ‘Buy-Side’ (institutional) companies, Investment Banks, Pension Funds, Total/Absolute-Return/Hedge Funds, Sovereign Wealth Funds, Corporate and Market-Making/Trading institutions and informed individuals, use the ‘registration’ to the left of the page.
Why is Independent Research important?
Only conflict-free research can be used as an viable tool in investment decision-making.
How can you insure unbiased research?
Member business models are based on revenues paid to them for providing quality research – not from investment banking, underwriting, proprietary trading or market making, advisory or consultancy services for clients other than investors, or from companies that are the subject of their research.
What does IRP stand for?
Independent Research stands for quality, impartial investment research.
Connect to the IRP Journal via Twitter: IRP Journal TWITTER
WaveTrack is memember of the EuroIRP Association and supports the development of Independent Research.
Alcoa equity Elliott Wave Update
by m.tamosauskas| April 4, 2015 | 2 Comments
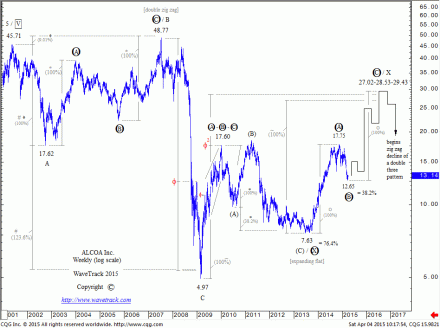
Back in 2013, Alcoa was recognised as completing its counter-trend decline from the Jan.’10 high of 17.60 into the July ’13 low of 7.63 whilst unfolding into an expanding flat pattern. This represents wave ‘X’ within a larger double zig zag advance that began from the March ’09 low of 4.97: http://goo.gl/gEgF15 .
A reversal signature to the upside confirmed this forecast and prices doubled in a little bit more than a year:
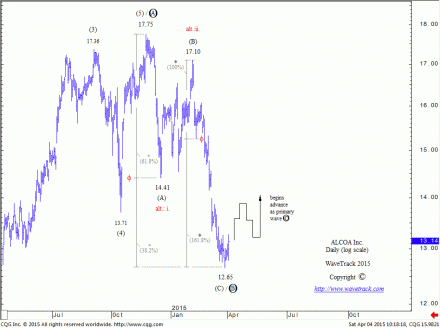
It has slightly exceeded our ideal interim upside targets with a recorded high at 17.75 in Nov.’14 but since then has gradually underperformed its benchmark S&P 500 index and currently trades -25% down from the 17.75 high – a fib. 38.2% retracement level of the preceding advance. A closer look reveals a three wave sequence has unfolded with 61.8%/38.2% correlation ratio within this decline:
The minimum requirement has been achieved and we do believe Alcoa might be in its early stages of final advance towards new recovery highs. Ultimate upside targets are updated to 27.02-28.53-29.43 basis various fib-price-ratio measurements (see fig #1). Another price doubling during the next few years? Our Elliott Wave analysis suggests it’s the most probable outcome!

