Gold Bullion – Time to be a Contrarian!
by WaveTrack International| July 20, 2015 | No Comments
Gold – Time to be a Contrarian!
The Gold bullion declined over $53 dollars overnight as reports came through that half-an-hour after the Shanghai Gold Exchange opened, a Chinese source sold 5 tonnes of gold causing the sharp mark down of prices to a bullion low at 1081.30. Within minutes of the selling being completed, prices recovered quickly to 1114.80 as the London bullion dealers arrived at their desks to begin trading – there wasn’t much opportunity to buy at the cheaper levels, certainly not if your located in Europe or the U.S.
The sell-off traded smack into our long-awaited downside targets between 1096.00-91.16+/-, overreaching by just $9.8 dollars!
Gold – Daily Chart
This latest action has far-reaching implications for the future of precious metals – one-by-one, all of the major commodity markets have been signalling the approach of a major ‘inflexion point’ – subscribe to the latest EW-Compass report and access the Gold/Silver forecasts, and the medium-term outlooks for Precious Metals and key indices like the GDX Gold Miners and XAU Gold/Silver Miners in our TWO-PART VIDEO SERIES.
GDX – Gold Miners Index
XAU Gold/Silver Index
Don’t miss out – get up-to-date now!
Subscribe to the EW-Compass here…
Falling off the cliff (Lonmin PLC Elliott Wave update)
by m.tamosauskas| July 14, 2015 | No Comments
Over two months ago we have published our Elliott Wave forecast for the Lonmin PLC describing the topping formation in progress (see the link): ‘The Lonmin is expected to stage a final sell-off during the next few months prior to beginning the new bull market. Basis Elliott Wave analysis, the advance that began from the March ’15 low of 105.70 unfolded into a single zig zag pattern, labelled a.-b.-c. in minor degree with a completion into the recent high of 157.50. Note a fib. 61.8%/38.2% ratio within a single zig zag pattern. The recent spike and an immediate reversal to the downside suggest the final sell-off has already begun from the 157.50 high’.
Basis this forecast, a minimum downside target was below the March ’15 low of 105.70 – already a massive minus -33% downside risk. Wondering where it is trading now? Subtract 50% from the May ’15 high of 157.50 and you are here:
Tags: bottom > crash > Gold Miners
Euro Stoxx 50 – EuroGroup Leaders Agree Greek Deal
by WaveTrack International| July 13, 2015 | No Comments

EuroGroup Leaders Agree Greek Deal
In lengthy emergency discussions that lasted all night, the EuroGroup leaders have finally reached a deal with Greece that ensures a third bail-out will go ahead. European Council president Donald Tusk said ‘Euro summit has unanimously reached agreement. All ready to go for ESM programme for Greece with serious reforms and financial support’. German Chancellor Angel Merkel has just finished a press statement a few minutes ago to confirm the EuroGroup membership is unanimously behind supporting Greek reforms and restructuring.
Stock indices are higher on the open, adding on to last week’s gains.
Last week’s forecasts of the Euro Stoxx 50, Xetra Dax, Greece’s ATG index and Greek 10yr bond yields provided EARLY CLUES that a positive outcome would prevail surrounding the Greek Debt negotiations – especially since the Euro Stoxx 50’s counter-trend pattern that have been in force since mid-April was already completing last Wednesday and signalling a reversal upswing was about to resume the larger, prevailing uptrend. Today’s announcement is therefore no surprise given key indices have already traded higher by more than +7.5% into last Friday’s close – adding this morning’s advances, this figure is now +9% per cent!
Euro Stoxx 50 – 120 mins. by WaveTrack International
What we’ve just experienced is actually quite amazing! – the natural development of price-data results in building a typical Elliott Wave pattern to a conclusion before any news-related effect occurs. This is powerful stuff, but the real work is in our ‘self-belief’, comprehending that such ‘causal’ energies trigger rippled ‘effects’ through the time and price line of growth and decay! But at the very least, it confirms that the news-flow is not the ‘causal’ origin of price-determination and development – something else is secretly at work!
See WaveTrack’s post 4th July 2015 before the referendum! Greece Special!
See our post 10th July 2015 – Euro Stoxx 50 Jump annuls Grexit concerns!
Subscribe to the EW-Compass report – cutting edge Elliott Wave and Fibonacci Ratios!
Tags: success
EuroStoxx 50 Jump Annuls Grexit Concerns!
by WaveTrack International| July 10, 2015 | No Comments

European markets have staged price-rejection into key ‘golden-ratio’ levels during Wednesday’s trading with the EuroStoxx 50 ending its double zig zag pattern from the April highs at 3291.39. Prices are now trading over 7% per cent higher basis today’s jump!
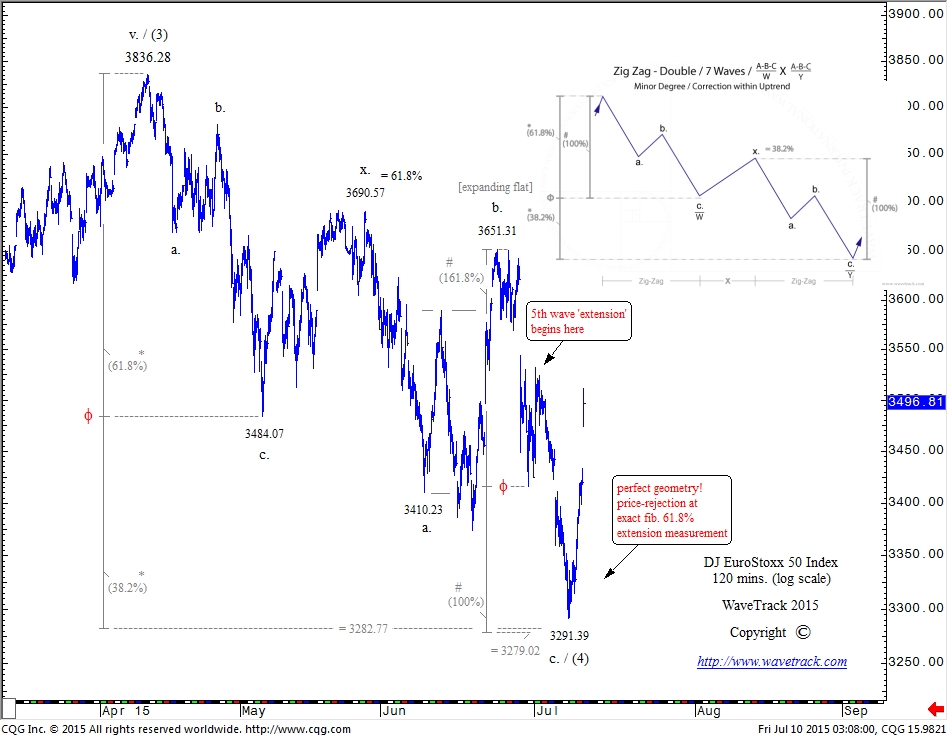
EuroStoxx 50 Index – Reversal-Signature at the ‘Golden Ratio’ level
Extending the first zig zag by a fib. 61.8% ratio projected the completion of the second zig zag to 3282.77 with the actual low coming in at 3291.39! Perfect geometry!
Even before this test occurred, the probability of a reversal-signature was assigned a high rating because of the integrity of the double zig zag pattern (see last Wednesday’s EW-Compass report) – compare this archetypal pattern with the tutorial (top-right of chart). It gave prior insight that whatever the outcome over the Greek debt negotiations, the markets would react favourably – this is in stark contrast to the latest Reuters poll that showed a majority of 55% economists were pessimistic, favouring a Greek exit!
What do you rely on for the sound evaluation of market trends?
WaveTrack’s Elliott Wave Success
GREECE Special | The Greek Debt Crisis – & What You Might Discover…
by WaveTrack International| July 4, 2015 | No Comments
The Greek Debt Crisis and What You Might Discover!
‘It was never easy to look into the future, but it is possible, and we should not miss our chance’ – Andrei Linde
Peering into the future has its risks – the ancients always said that only our Creator has the ‘Unrestricted Eye’. But through time immemorial, Pharos, Kings and Scholars have sought a glimpse into the future, seeking the help of Alchemists, Philosophers, even the Oracle of Delphi along the way. In a strange, eerie sort of way, using the ‘deterministic’ qualities of the Elliott Wave Principle as our guide, we’re attempting to gain a peek into the financial-future in the same way.
The Greek austerity referendum is taking place this Sunday, and it seems that all hinges on its outcome. The news-media is full of speculation and as always, opinion is not in short supply. So is there really anything reliable out there that can help us gain an idea on how the markets will react following the results of the vote?
In our latest Elliott Wave report, we’ve added analysis of the Greek ATG Stock Index and the Greek GR10yr Yield. What we’ve discovered may surprise you!
Rather than a random sequence of price development, the Greek ATG index can be seen unfolding into a specific Elliott Wave impulse pattern from its March ’14 high of 1379.42. This five price-swing sequence is an archetypal pattern with deterministic qualities – its June ’15 low at 651.78 was no coincidence, adhering to specific geometric measurements. There’s no doubt about the next price moves it must make to adhere to one of the EWP’s basic laws, that of ‘balance’.
And this already gives us an immediate glimpse into how the markets will react next week!
Also, the Greek GR10yr yield corroborates the next steps for the ATG index as recent interest rate rises to 14.785% are again moulding towards an important climax.
The analysis of both these contracts appear in our special production of our latest Elliott Wave Compass report. Follow the links to obtain this latest edition or contact us at services@wavetrack.com for more information. Get the report now.
Tags: 10yrYields > crisis > debt > elliott wave > Greece
The power of correlation studies (Elliott Wave analysis)
by WaveTrack International| July 4, 2015 | No Comments
We place a lot of emphasis to comparison studies of correlated asset classes. Each has its own rhythm, vibration frequency and although the exercise is to pair off or group differing ones into positive or negative correlations, the real insights gained are from examining their subtle differences and finding out what their common denominators are in terms of pattern. In other words, discovering what Elliott Wave pattern sequence fits each individual contract whilst it simultaneously conforms to a common denominator of synchronised price development. This provides a unique perspective in the task of price-determination, price-prediction as it helps to eliminate certain possibilities through discrepancies whilst highlighting those with the greatest probabilities of coordination. We tend to use this method on a day-to-day, top-down basis to any Elliott Wave analysis that we publish. Let us visualize one of examples. In Jan.’15 gold broke above 1300.00 US$ dollars and it was suspected to finish it’s larger counter-trend advance near 1310.00+/- US$, measured by extending minute wave a by a fib. 61.8% ratio. The corresponding GDX – Gold Miners Index was also expected to complete its counter-trend single zig zag advance from the Nov.’14 low of 16.45 with upside objectives measured towards 23.25+/- derived by using the same fib-price-ratio methodology. A synchronized response and a reversal signature to the downside on both contracts gave us a clear signal – both are ready to resume their larger declines and they did.
MID-YEAR (2015) ELLIOTT WAVE VIDEO UPDATE of GLOBAL MARKETS
by m.tamosauskas| June 30, 2015 | 3 Comments

Dear Elliott Wave Enthusiast!
This is our regular 6-month update of Global Markets and it’s a completely FREE addition to your current subscription of the Elliott Wave Compass report. Peter Goodburn, who heads the team of Elliott Wave analysts here at WaveTrack International is again our host as he leads us through some of the major themes and trends developing in these three important asset classes.
Peter’s in a unique positon to help guide us through the next stages of what is expected to be another major shift in trends, and if nothing else, blow the lid on some market misconceptions! After all, he knows a thing or two about the commodity markets – he was trading in the dealing rooms during the late 1970’s when the Hunt brother’s attempted to corner the world silver market –and at a later date in his career, trading currencies for some of the world’s major central banks – and during the early part of the 2000’s, advising major European T-1 & T-2 banks on directional interest rate movements. These in-depth experiences in different asset classes led Peter to devise cross-relationship analysis of what he describes as ‘market interdependency’ – no asset class is isolated from the tides and rhythms of monetary asset flows – and to gauge how each develops, an examination of positive/negative correlations is an essential element in that assessment process.
This is good reason to bundle these next three areas of finance together – COMMODITIES, CURRENCIES & INTEREST RATES.
And there’s no better way to examine these correlations than allowing them to ‘speak’ to us through the deterministic methodology of the Elliott Wave Principle!
After completing the recording of this latest video, Peter explained, “…even after 30-years of practicing the Elliott Wave Principle, I still find it humbling when patterns jump out at you, to reveal their ‘hidden’ future, of what is to come. I’ve looked at length into many other systems of analysis over this time, from the downright quirky to the more esoteric of methodologies, but none have exhibited the same sublime simplicity and accuracy that the Elliott Wave Principle reveals…”.
This latest video of COMMODITIES, CURRENCIES & INTEREST RATES includes our most comprehensive study of the commodity markets and related equites that we’ve ever published in video format. It’s much longer than we’d originally intended but Peter insisted on making sure you had everything that he thought was critical to the next stage of the up-coming ‘INFLATION-POP’ scenario. The video lasts for 115 minutes, yes, that’s nearly 2-hours! It’s a marathon, but a necessary step in understanding the next major moves for the next few years (don’t worry, you can stop/pause or fast-forward if you like! – just sit back & enjoy!).
To view the video, ensure your Elliott Wave Compass subscription is up-to-date – simply log-in then follow these instructions:
PART I & II. of WaveTrack semi-annual video series can be watched immediately, by logging into the EW-Compass software and clicking on the text-link provided within the SUMMARY window.
All the very best to you,
The Elliott Wave Analysis Team
Elliott Wave pattern of the month (Xetra Dax 30)
by m.tamosauskas| June 29, 2015 | 3 Comments

Success! Elliott Wave Pattern for the XETRA DAX
In the case of the Dax index, the initial decline into the 11619.72 low was labelled (minute) wave a of the sequence. It was followed by wave b rallies that exceeded the point of departure of wave a and traded into ‘uncharted’ territory. Wave c however proved to be the most interesting wave – first, it declined in an impulse-like fashion (c-waves of flats have to unfold into impulsive structures) but then engaged into a more overlapping type of price activity. This was early spotted by our analysts who described wave c as unfolding into an ending expanding-diagonal.
Originally, downside objectives were measured basis the substructure of the diagonal’s 5th wave – downside extension of the Dax however led us to apply a fib. 161.8% extension of wave a of the flat. This is typically the maximum we expect wave c to travel – and indeed, also in this case the Dax reversed close to this downside target (shown by the dotted line) and has since staged a reversal signature that has corroborated additional upside in the weeks ahead, regardless the Greek circus.
Tags: debt crisis > Greece
PART II ‘COMMODITIES, CURRENCIES & INTEREST RATES’
by m.tamosauskas| June 27, 2015 | No Comments

A long awaited semi-annual video repot PART II ‘COMMODITIES, CURRENCIES & INTEREST RATES’ is finished! The commodity section has been expanded and our analysis continues to grow from your demand – there are 60 individual charts in this report. The next stage of ‘Inflation-Pop’ is set to begin soon. Some laggard commodities are still attempting to finalise their multi-year, counter-trend declines with sector synchronizing into the July/August period. Composite cycles have already turned higher with an uptrend trajectory for the next several years into the end of the decade. Some outstanding opportunities lies ahead with multiple upside potential. We will upload the video early next week and make it available for our subscribers. Broaden your horizon in financial markets, learn our fib-price-ratio methodology and get ready for some crazy price developments!
Gold – Silver Ratio (Elliott Wave Update)
by WaveTrack International| June 23, 2015 | No Comments
The advance that began from the mid-May ’15 low of 69.09 is taking the form of a five wave expanding-impulse pattern, labelled [i]-[ii]-[iii]-[iv]-[v] in minuette degree. The ratio might be already completed its advance into the recent high of 74.52, although a higher high is still possible. Despite this however, the pattern development looks very mature and soon we do expect a balancing phase to begin with downside objectives measured towards 71.75-71.15+/-. This means that the gold – silver relationship will change – silver is expected to outperform relative to gold for the next few weeks.

Recent Posts
Recent Comments
Archives
- February 2026
- December 2025
- August 2025
- July 2025
- June 2025
- March 2025
- February 2025
- January 2025
- December 2024
- August 2024
- July 2024
- June 2024
- May 2024
- April 2024
- February 2024
- January 2024
- December 2023
- August 2023
- July 2023
- June 2023
- March 2023
- February 2023
- January 2023
- December 2022
- November 2022
- October 2022
- August 2022
- July 2022
- June 2022
- May 2022
- March 2022
- February 2022
- January 2022
- December 2021
- August 2021
- July 2021
- June 2021
- March 2021
- February 2021
- January 2021
- December 2020
- November 2020
- August 2020
- July 2020
- June 2020
- May 2020
- April 2020
- March 2020
- February 2020
- January 2020
- December 2019
- October 2019
- September 2019
- July 2019
- June 2019
- May 2019
- April 2019
- March 2019
- February 2019
- January 2019
- December 2018
- November 2018
- September 2018
- August 2018
- July 2018
- June 2018
- May 2018
- April 2018
- March 2018
- February 2018
- January 2018
- December 2017
- November 2017
- October 2017
- September 2017
- August 2017
- July 2017
- June 2017
- May 2017
- March 2017
- February 2017
- January 2017
- December 2016
- November 2016
- October 2016
- September 2016
- August 2016
- July 2016
- June 2016
- May 2016
- April 2016
- March 2016
- February 2016
- January 2016
- December 2015
- November 2015
- October 2015
- September 2015
- August 2015
- July 2015
- June 2015
- May 2015
- April 2015
- March 2015
- February 2015
- January 2015
- December 2014
- November 2014
- October 2014
- September 2014
- August 2014
- July 2014
- June 2014
- May 2014
- April 2014
- March 2014
- February 2014
- January 2014
- December 2013
- November 2013
- October 2013
- September 2013
- August 2013
- July 2013
- June 2013
- May 2013
- April 2013
- March 2013
- February 2013
- January 2013
- December 2012
- November 2012
- October 2012
- September 2012
- August 2012
Categories
- ADXY Index
- Agnico Eagle Mines
- AI Artificial Intelligence
- Alcoa
- Amazon
- AngloGold Ashanti
- Antofagasta
- APPL
- Apple
- ASX 200
- AUD vs USD
- AUDNZD
- AUDUSD
- Australia ASX 200
- Baltic Dry Index
- Banking
- Base Metals
- Biotechnology
- Bitcoin
- Bovespa
- Broadcom
- Catalexit
- central banks
- Christmas
- Commodities
- Commodities Video Outlook 2020
- Conference
- Copper
- Coronavirus Sell-Off
- CRB
- Crude oil
- crude oil price chart
- CryptoCurrency
- Currencies
- Currencies + Interest Rates Video Outlook
- Cycles
- Dax 30
- deutsche bank
- Dewey Cycle
- DJ Transportation Average
- DJ Utilities
- Dow Jones 30
- Dow Theory
- ECB
- economy
- Elliott Wave
- Elliott Wave Charts
- Elliott Wave Patterns
- Elliott Wave Principle
- Emerging Markets
- Ending-Diagonal Elliott Wave Pattern
- Equity
- EUR vs CHF
- EUR/USD
- Euro / US$
- Eurostoxx 50
- EuroStoxx50
- EuroStoxxBanks
- EURUSD
- Expanding Flat Pattern
- FAAMG
- FANG+
- fib-price-ratio
- Fibonacci Trading
- Fibonacci-Price-Ratio
- Financial Forecasting
- Fixed Income
- forex
- Freeport McMoran
- FTSE 100
- Fund Management
- FX
- FXStreet
- GBP/AUD
- GBP/USD
- GDX
- GDXJ
- Germany 10 year Euro Bund future
- Gilead Sciences
- Glencore
- Global Economy
- Gold
- Gold Mining
- Golden Ratio
- goldman sachs
- Google Inc.
- Google/Alphabeth
- Greek debt crisis
- Hang Seng
- Harbinger
- Hungarian Forint
- IBEX 35 Index Spain
- Independent Research
- India-CNX Nifty 50
- Interest Rates
- Interview
- IRP Independent Research
- kbw bank index
- Lonmin
- MAG-7
- McDonald's
- MID-YEAR VIDEO UPDATE!
- Mifid II
- Mines
- Mining
- MSCI China
- MSCI Emerging Markets
- Nasdaq 100
- Nasdaq Biotechnology Index
- Nasdaq Composite
- Nasdaq100
- Netflix
- Newmont Mining
- Nikkei 225
- NVIDIA
- NYSE Composite Index
- Palladium
- Platinum
- Precious Metals
- Ralph Nelson Elliott
- Reversal-Signature
- Russell 2000
- Russia RTS
- S&P 500
- Sector
- Secular-Bull
- Sentiment Survey
- Shanghai Composite Index
- Silver
- Slanting Flat Elliott Wave Pattern
- SP100
- SP400 Mid-Cap
- SP500
- SPX 500
- STLG/AUD
- Stlg/US$
- STLG/USD
- STLG/YEN
- STLG/ZAR
- Stock Index
- Stock Index Tracking
- Stock Index Video
- Stock Indices
- Stock Indices Video Outlook 2023
- Stock Indices Video Outlook 2025
- Sugar
- Summary
- Tesla
- Tesla Inc
- Toyota
- Track Record
- trading
- Trusts
- Tutorial
- Uncategorized
- UniCredit
- US
- US Dollar Index (DXY) (USDX)
- US$ Index
- US-Dollar Index
- US10yrYields
- USD
- USD/ARS
- USD/CNY
- USD/IDR
- USD/INR
- USD/MXN
- USD/SGD
- USD/THB
- USD/YEN
- USD/ZAR
- Vale
- Value Line Index
- video
- VIDEO OUTLOOK 2018
- VIDEO OUTLOOK 2020
- VIX
- W.D. Gann
- WaveTrack International
- XAU Gold/Silver Index
- Xetra Dax
- XOP
- Yields
- Zig Zag
- Zinc
- ‘INFLATION-POP’
- ‘SHOCK-POP-DROP’