FOREX and INTEREST RATES – Post-Brexit Video Update!
by WaveTrack International| June 27, 2016 | No Comments
Forex and Interest Rates Video Update! Post-Brexit – Order resides in Chao
POST-BREXIT – Order resides in Chaos!
This mid-year video update is the third and final installment in the three-part series of Elliott Wave Forecasts. Part III takes a look at the developing trends of CURRENCIES & INTEREST RATES and comes just a couple of days following the U.K.’s referendum ‘Brexit’ vote.
We take a look at the aftermath of the Brexit and attempt to answer whether there’s been any material change in the larger trends of global currency pairs and crosses that were already in motion beforehand. We’ll be covering over 48 charts and examining the Elliott Wave pattern development of the following:
• US$ index
• Euro/US$
• Stlg/US$
• US$/Yen
• US$/CHF
• AUD/US$
• US$/CAD
• Euro/Stlg
• Euro/Yen
• Asian ADXY
• US$/ZAR
• US$/BRL
• US$/CNY
Major cycles are also updated along with a cursory look at the US$ dollar versus the Korean Won, Singapore Dollar, Indian Rupee, Taiwan Dollar, Thai Baht, Malaysian Ringgit, Indonesia Rupiah and the Philippine Peso.
Sterling/British Pound has obviously seen the largest movements following the Brexit announcement, but you might be surprised to see how it looks within the long-term trend against the US$ dollar. We also find some confirmatory pattern development for Sterling/British Pound against the Euro.
In terms of interest rate analysis, we add the U.K.’s UK10yr yield analysis for the first time into the video series. We take a look at its long-term yield decline from the inflationary heights of the early 1980’s and what impact last week’s decline had when it traded down to new 35-year lows. We also clarify the ongoing trends for the US10yr treasury yield with updated target levels for year-end – plus the very latest effects of the ECB’s recent attempts to stem deflation in the Eurozone and the Bund Yield’s safe-haven effects following Brexit.
• US 30yr Yields
• US 10yr Yields
• US 10yr Yields Cycle
• Germany 10yr Yields
• UK 10yr Yields
HOW CAN YOU RECEIVE THE VIDEO FORECAST?
To receive your VIDEO UPDATE please click here to contact us.
– Please state if you wish to purchase the SINGLE VIDEO for either STOCK INDICES or COMMODITIES or CURRENCIES/INTEREST RATS for USD 48.00 (plus VAT)?
– Or opt for the TRIPLE PACKAGE for USD 96.00 in total?
– Next we will send you a PayPal payment request and provide you with the video link & PDF report once confirmed.
This is the most insightful and precise Elliott Wave financial forecast available.
Most sincerely,
WaveTrack’s Elliott Wave Team
Visit us @ www.wavetrack.com or read more about our STOCK INDICIES VIDEO UPDATE here
Visit us @ www.wavetrack.com or read more about our COMMODITIES VIDEO UPDATE here
BREXIT and Elliott Wave
by WaveTrack International| June 14, 2016 | No Comments
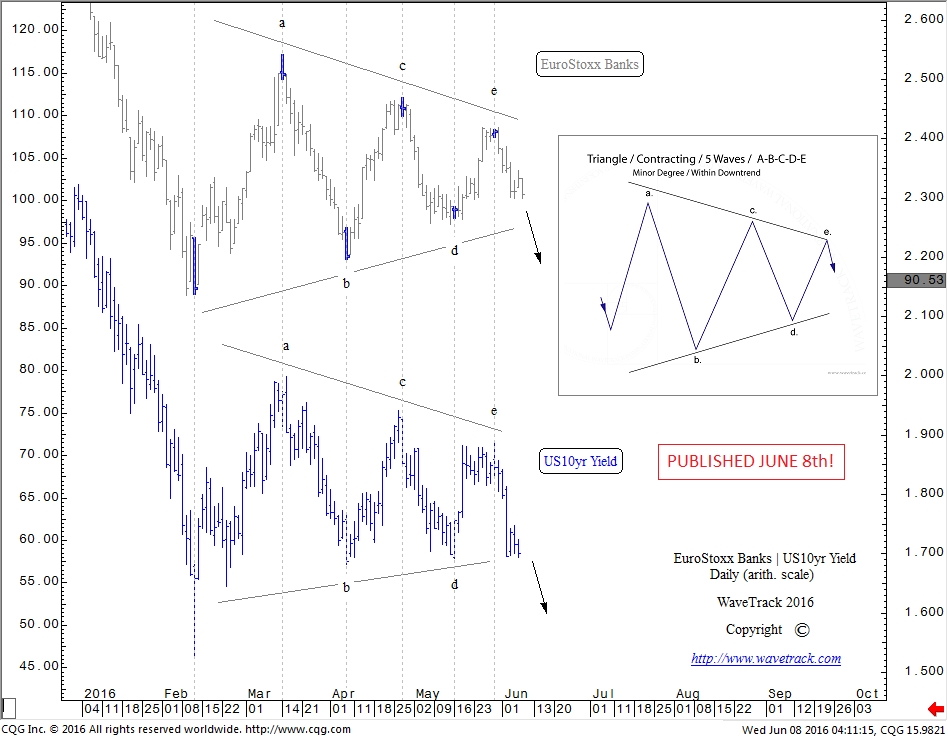
EuroStoxxBanks | US10yr Yields – Daily
Elliott Wave Triangle – Eurostoxx Banks index + US10yr Treasury Yield Forewarns Decline Ahead of Brexit Poll Change. Elliott Wave can be a powerful tool for financial forecasting – independent insights which can predict when newsflow is failing to give a clear answer.
Purchase full report here
And receive the latest Elliott Wave insights by subscribing to the EW-COMPASS report.
Visit us @ www.wavetrack.com
Subscribe here Elliott Wave Compass
Tags: Brexit
COMMODITIES Resurgence! Semi-Annual Video Update!
by WaveTrack International| June 10, 2016 | No Comments

Commodity – Resurgence! New Elliott Wave Video Forecast
We’re pleased to announce the publication of WaveTrack’s mid-year video update of medium-term forecasts for COMMODITIES!
Back in January this year, WaveTrack International’s annual 2016 Elliott Wave Commodity forecasts forewarned of an imminent and major low being approached for all of the main sectors, Base Metals, Precious Metals and Energy/Crude Oil contracts. It didn’t take long for this to be realised! Led slightly earlier by Precious Metals, Gold and Silver bottomed the previous month, in December, closely followed by double-bottom activity in Crude and Brent Oil – Base Metals also responded in major reversals although less enthusiastic in their subsequent advances. Gold has since traded higher by +24% per cent, silver by +32% per cent, Crude Oil by a massive 92% per cent and copper so far lagging but higher by +18% per cent. Some of the commodity equities we identified as big buying opportunities, especially those for precious metals came good with Newmont Mining up by a massive +194% per cent!
Precious and Base metals have since given back some of those initial gains but the BIG MESSAGE derived from these initial movements is this – we can expect even higher levels during the next several years.
In this mid-year update, we’ll be updating all of the contracts shown last January, plus a few new correlations that we hope will distil and clarify some of the ongoing trends –
The COMMODITIES list includes medium/long-term Elliott Wave analysis for the following:
In this video Peter discusses the various intricacies revealed by his correlation studies to forecast yet another supporting strong evidence of a Commodity Resurgence.
We’ll send you a personal link so that you can watch the video, anytime at your convenience.
COMMODITY TRACK RECORD SAMPLE:

Commodities – Newmont Mining – Weekly
Since then, Newmont Mining has traded higher by an amazing +108% per cent!
And if you followed the CURRENCY video in combination with the Emerging Market and Commodity outlooks, you would have been fully prepared for a big change in the US$ dollar, and related EM/Commodity Currencies, like the Canadian Dollar:

Currencies – USD vs. CAD – Weekly
CONTACT US NOW VIA EMAIL – SELECT YOUR PACKAGE
Single Video – $48.00 – PART II COMMODITIES
Triple Package offer – $96.00 (saving 33%)! – PART I – PART II – PART III
PART III will be available in a few weeks’ time – we’re working on it!
HOW CAN YOU RECEIVE THE VIDEO FORECAST?
To receive your VIDEO UPDATE please click here to contact us.
– Please state if you wish to purchase the SINGLE VIDEO for COMMODITIES for USD 48.00?
– Or opt for the TRIPLE PACKAGE for USD 96.00 in total?
– Next we will send you a PayPal payment request and provide you with the video link & PDF report once confirmed.
This is the most insightful and precise Elliott Wave financial forecast available.
Most sincerely,
WaveTrack’s Elliott Wave Team
Visit us @ www.wavetrack.com or read more about our STOCK INDICIES VIDEO UPDATE here
GOLD – Just for the record
by WaveTrack International| May 31, 2016 | No Comments
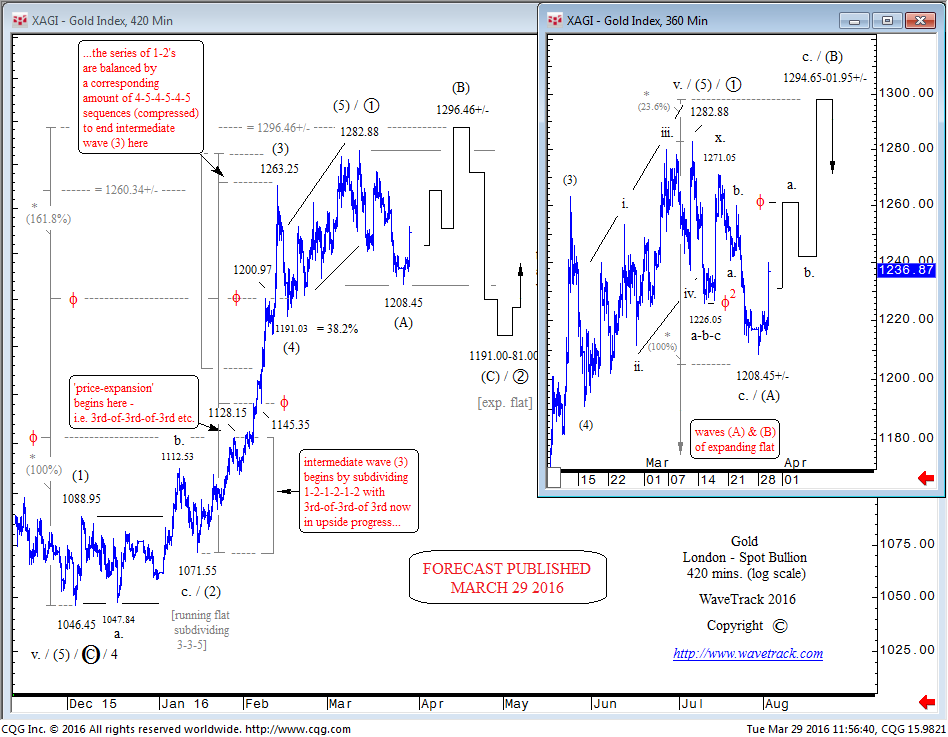
Gold (LME) – 420 mins. – Track Record
Just for the record! This forecast has been published by WaveTrack’s Elliott Wave team on the 29th March 2016! If you follow Gold – the result is pretty impressive. Or it perhaps not if you understand Elliott Wave and can forecast an Expanding Flat correction for GOLD?
Receive the latest Elliott Wave insights by subscribing to the EW-COMPASS report.
Visit us @ www.wavetrack.com
Subscribe here Elliott Wave Compass
XME Index (ETF) – Elliott Wave Symmetry
by WaveTrack International| May 30, 2016 | No Comments
XME – Metals & Mining Index (ETF) – (AMEX) – 120 mins.
The XME index (ETF) is a composite index of the major mining companies, totaling 38. Their interests span across many different commodities including the major metals miners such as Freeport McMoran Copper, Noranda Aluminium but also Arch Coal, Newmont Mining Gold and United States Steel, to name a few.
This year’s annual 2016 Elliott Wave forecasts announced an imminent low was forming, ending declines that began from the April ’11 highs. The XME was no exception – important lows were also being approached by the entire commodity asset-class.
Since January’s low, a near-perfect five wave impulse pattern has unfolded higher, assigned to minor degree, i-ii-iii-iv-v. Its 3rd wave underwent ‘price-expansion’ which is consistent with approximately 80-85% per cent of ‘expanding’ impulse patterns where third waves are normally the longest of the three sequences. The 5th wave is slightly shorter than the 1st but that’s quite okay with a visible five wave subdivision in the pattern to its terminal high at 25.13.
From a geometric, ratio/proportion perspective, there is also a visible adherence to the Fibonacci sequence. Extending the 1st wave to 15.53 by a fib. 161.8% ratio projects a terminal high for the 5th wave to 25.68 – with the actual high finishing the pattern at 25.13, this is accurate especially when taking into account the slight price-spike that ended the 1st wave high.
A counter-trend pattern is now in full swing to the downside. The activity so far suggests this is taking the form of a double zig zag pattern although a single zig zag count is also possible. Extending the initial downswing to 20.01 by a fib. 61.8% ratio projects a terminal low towards 17.38+/-. This measurement is valid for both the single or double zig zag pattern. Remember, should prices test the 17.38+/- level, be aware that the pattern could still mutate into a triple zig zag by searching for even deeper retracement levels.
Get access to WaveTrack’s bi-weekly Elliott Wave Compass report featuring many short-term updates of all 4 asset classes!
Successful trading with WaveTrack International
Subscribe to the EW-Compass here…
Tags: XME Index
STOCK INDEX VIDEO – Code Word “Re-Synchronisation”
by WaveTrack International| May 26, 2016 | 2 Comments

ANNOUNCEMENT | 24th May 2016
MID-YEAR ELLIOTT WAVE VIDEO SERIES – PART I/III – STOCK INDICES
Elliott Wave Price Forecasts & Cycle Projections for 2016/17
Re-Synchronisation of Developed vs. Emerging Markets!
We’re pleased to announce the publication of WaveTrack’s mid-year video update of medium-term forecasts for STOCK INDICES!
Since the inaugural edition of the EW-Compass report was published, you’ve asked for accompanying medium/long-term analysis in gaining a broader perceptive of Elliott Wave pattern development for many of the world’s major indices. So we’ve taken many charts from our institutional Elliott Wave Forecast database and compiled them into a video series, publishing each December/January, exactly for this purpose in preparation for the coming year.
As the demand for more indices grew, so did our task in maintaining them to a sufficient standard – no problem! So now, we’ve set aside sufficient resources to ensure the medium/long-term outlooks are sent to you – not just once but TWICE a year!
There are over 120 charts being maintained round the clock so it’s necessary to split the videos into THREE parts – Part I STOCK INDICES, PART II COMMODITIES & PART III CURRENCIES & INTEREST RATES.
PART I Stock Indices VIDEO is available NOW!
This latest update of U.S., European and Global/Emerging market indices covers 40 newly illustrated Elliott Wave forecasts of the medium and long-term time-series. Our Chief Elliott Wave analyst and Founder of WaveTrack International, Peter Goodburn is again your host. Once again, he talks us through all of the main themes and up-coming changes that are apparent within the pattern development of the major markets. He also illustrates some of the major cycles for the benchmark S&P 500 index, expounding his articulate knowledge of cyclicity obtained from his 25-year study of luminaries such as Edward Dewey and W.D. Gann.
The stock index list includes medium/long-term Elliott Wave analysis for the following:
• Recap of S&P forecasts of last several years
– Performance – Secular-Bear vs. Secular-Bull
• Comparative Charts of Developed Markets vs. Emerging Markets:
– highlighting Re-Synchronisation
• Affirmation of last year’s S&P forecasts
– extended 3rd or 5th wave development
• Weekly S&P composite cycle and its trend for the next 12-18 month period
• S&P Elliott Wave counts for the next several months incl. specific target levels
• Another look at the 18yr and 43.5yr cycles
• S&P from the Great Depression lows and ultimate targets
• Dow Jones & Fibonacci perfection!
• Nasdaq 100 – positive correlation and 6-12 month price objectives
• Russell 2000 – small-cap outlook
• Sectors – KBW Banking Index
• Sectors – Nasdaq (NBI) Biotechnology
• Europe – Eurostoxx 50
• Europe – Xetra Dax
• MSCI Emerging Market Index – RE-SYNCHRONISATION
• MSCI BRIC (Brazil-Russia-India-China)
• Brazil – Bovespa Index
• Russia – RTS Index
• India – Sensex Index
• China – MSCI China Index
• Shanghai Composite
• China Enterprises
• MSCI Hong Kong
• Hang Seng
• Singapore Straits Times
• Australia – All-Ordinaries
• Japan – Nikkei 225 Index
Peter’s work is absolutely unique – you’ll be taking a look at Elliott Wave counts never seen anywhere else – GUARENTEED!
His 25-years of ground-breaking research into the seamless adherence of pattern development unfolding within specific geometric, Fibonacci dimensions provides the foundation for all the Elliott Wave forecasts shown in this video. This has enabled Peter to identify major directional changes ahead of time over the last sixteen years – for example:
In last December’s Stock Index update, Peter described how major indices were trending lower but with the S&P’s cycle analysis signalling a major low in late-January/February – see this cycle analysis below…

S&P 500 – Weekly -Composite Cycle
…and how the KBW Banking Index was finalising a major low before resuming its medium-term uptrend…
WaveTrack’s KBW Banking Index Forecast – Weekly
These were just two hints that markets were going to get off to a shaky start, but then turn around to resume larger uptrends!
Get Up-to-date on the next 6-month outlook – & beyond!
As an Elliott Wave Compass subscriber, we’ve ensured you have access to this Institutional–grade analysis at very modest expense.
PART I Stock Indices VIDEO is available now, at only $48.00!
We’ll send you a personal link so that you can watch the video, anytime at your convenience.
And if you’d like to subscribe to the up-coming COMMODITIES & CURRENCIES videos in PART II & PART III, you can receive ALL THREE for $96.00! – that’s a saving of 33% per cent!
• Single Video – $48.00
• Triple Package offer – $96.00 (saving 33%)!
If you saw the EW forecasts for the COMMODITIES Video published in January’s PART II update, you’d find that downside targets were successfully achieved!…here’s an extract:
Commodities – Newmont Mining – Weekly
Since then, Newmont Mining has traded higher by an amazing +108% per cent!
And if you followed the CURRENCY video in combination with the Emerging Market and Commodity outlooks, you would have been fully prepared for a big change in the US$ dollar, and related EM/Commodity Currencies, like the Canadian Dollar:
Currencies – USD vs. CAD – Weekly
CONTACT US NOW VIA EMAIL – SELECT YOUR PACKAGE
Single Video – $48.00 – PART I STOCK INDICES
Triple Package offer – $96.00 (saving 33%)! – PART I – PART II – PART III
PARTS II & III will be available in a few weeks’ time – we’re working on it!
HOW CAN YOU RECEIVE THE VIDEO FORECAST?
To receive your VIDEO UPDATE please click here to contact us.
– Please state if you wish to purchase the SINGLE VIDEO for STOCK INDICES for USD 48.00?
– Or opt for the TRIPLE PACKAGE for USD 96.00 in total?
– Next we will send you a PayPal payment request and provide you with the video link & PDF report once confirmed.
We’re sure you’ll reap the benefits – don’t forget to contact us with any Elliott Wave questions – Peter is always keen to hear you views, queries and comments.
Most sincerely,
WaveTrack’s Elliott Wave Team
Visit us @ www.wavetrack.com
DJ Transportation Average – The Beginning of a Major Advance
by WaveTrack International| April 22, 2016 | No Comments
The price declines that began unfolding for the DJ Transportation Average from the November ’14 all-time-high of 9310.20 ended a typical counter-trend zig zag pattern last January at 6403.30. This is labelled as a 4th wave retracement within the upward progress of intermediate wave (3) that began its uptrend from the Oct.’11 low. A 5th wave advance is now engaged to the upside with ultimate targets towards 10876.20+/- derived where it unfolds by a fib. 61.8% ratio of the net advance of the 1st-3rd waves.
It may take another year or so before the 10876.20+/- number is reached with the condition that it subdivides into a five wave expanding-impulse pattern, labelled in minute degree, 1-2-3-4-5.
DJ Transportation Average – 60 mins. – WaveTrack International
Minute wave 1 began this uptrend last January from 6403.20 – see fig #1. It too must subdivide into a smaller five wave expanding-impulse pattern (the term ‘expanding-impulse’ is given to five wave patterns that contain ‘price-expansion’ in one of the impulse waves, i.e. 1-3-5 – in other words, one of the waves ‘extends’ so that it measures larger than the other two, commonly occurring in the 3rd wave position – this differentiates it from a ‘diagonal-impulse’ that does not contain the quality of ‘price-expansion’ – a diagonal contains ‘overlap’ because its 3rd wave has not expanded the price action).
The DJ Transportation Average’s upside progress began hesitantly, building into a series of gradual upside movements in a step-like progression associated with a sequence of 1-2-1-2-1-2’s. These are a function of ‘fractalisation’ where a 3rd wave subdivides into smaller degrees of trend prior to ‘price-expansion’. This is evident in the DJTA upswing until a 3rd-of-3rd-of-3rd wave advance began mid-February. The conclusion of price-expansion as this third wave ended on the 17th February at 7383.10. The series of 1-2’s, three of them in total must ultimately be followed by an equal amount of 4-5’s, i.e. 4-5-4-5-4-5. Two 4-5’s have so far completed, a third 4th wave as minuette wave [iv] into the early-April low at 7623.80. This leaves just one final 5th wave advance, as minuette wave [v] to develop higher.
A final upside target is measured towards the 8462.60+/- to 8491.70+/- levels. These are derived from two ‘golden-section’ measurements of the entire impulse pattern from the Jan. ’16 low. The point where price-expansion began at 7129.40 is extended from the Jan.’16 low by a fib. 161.8% ratio that projects to 8462.60+/-. Also, extending minuette waves [i]-[iv] by a fib. 61.8% ratio projects to 8491.70+/-.
So these become the main target levels for the completion of this impulse pattern. Naturally, a counter-trend decline will then begin a larger 2nd wave pullback. It will be interesting to see how deep that one evolves!
Stay up-to-date!
Institutions – contact us for access to the EW-Forecast database where over 200 forecasts are illustrated with market commentary including all time-series for all global indices.
Private-Clients – subscribe to the Elliott Wave Compass report for bi-weekly updates for stock indices, currencies, bonds and commodities
Mining Investment Asia 2016 Conference – Singapore 13th April 2016
by WaveTrack International| April 11, 2016 | No Comments
Mining Investment Asia 2016
Announcement – MINING INVESTMENT ASIA 2016 CONFERENCE SINGAPORE – 13th April 2016
WaveTrack’s founder Peter Goodburn is being invited by the high profile Mining Investment Asia 2016 conference in Singapore to speak about ‘Is the commodity super-cyle really dead? Cand inflation re-appear and what impact can this have on price-forecasts for copper and gold during the next several years’.
He will be featuring the impressive Copper forecast published in January 2011 (see below – forecast published in WaveTrack’s reknown ‘Base Metals Report’) and show during the conference WaveTrack’s updated forecast for 2016 and beyond.
WaveTrack’s Copper Forecast January 2011!
For more information visit www.mininginvestmentasial.com
Global Stock Index Tracking
by WaveTrack International| April 5, 2016 | No Comments
86% of Active Equity Funds Underperform – Can Stock Index Tracking Reverse this Figure?
86% of Active Equity Funds Underperform – Can Global Index Tracking Reverse this Figure?
A recent survey of 25,000 ‘active’ equity funds has revealed that firms based in Continental Europe, almost all underperformed their benchmark index over the past decade. A figure of 80% per cent underperformed over the past five-year period, rising to even higher levels in the Netherlands, Switzerland and Denmark.
The research by S&P/Dow Jones Indices also showed that 98.9% per cent of U.S. equity funds underperformed their benchmark over the last ten-year period as did 97% per cent of those specialising in Emerging Market funds and 97.8% per cent for those managing Global Equity funds.
U.K. active equity funds fared better by comparison, outperforming over a 1-3-5 year period but over 10-years, all categories underperformed.
These latest statistics are nothing new to the active vs. passive fund management debate on efficiency – it’s been hotly contested for the last decade and longer. There are trade-offs for both methodologies of course. Investing in ‘active’ equity funds enables managers to be agile in manging portfolios in an environment where price volatility has increased during the last decade-and-a-half. Passive funds attracts lower fees for the investor.
What can we glean from this survey?
A few aspects come to mind.
- The efficiency of active equity funds would not be debated if they outperformed the index, after fees, on a more regular basis.
- Over a ten year assessment, nearly all funds underperform – this is most probably due to the fact that it encompasses the period of the financial-crisis sell-off during 2007-09 – and yet, the percentage figures are still incredibly high over the 5-year sampling.
- It is driving investment out of active equity funds and into the low-cost exchange traded fund market which has a six-fold increase over the last decade to $2.9tn dollars.
But the real question remains not of underperformance per se, but its cause/s. Is this because of poor stock-picking? – if so, is the analysis underperforming? – if not, are there other causes such as the difficulties in adapting to high volatility in a non-trending environment? Maybe.
Can this underperformance trend be reversed?
Yes, it can. But first, it’s important to understand the real reason for underperformance. It doesn’t necessarily lie in the re-evaluation of bottom-up equity research consumed – it lies in the ability of individual fund managers to extricate themselves from the instinct of herding. This is imperative in an environment that is much more volatile than in previous decades. ‘Herding’ is the tendency for individuals to mimic the actions of the larger/aggregate group.
As Albert Phung explains: ‘There are a couple of reasons why herd behaviour happens. The first is the social pressure of conformity. You probably know from experience that this can be a powerful force. This is because most people are very sociable and have a natural desire to be accepted by a group, rather than be branded as an outcast. Therefore, following the group is an ideal way of becoming a member. The second reason is the common rationale that it’s unlikely that such a large group could be wrong. After all, even if you are convinced that a particular idea or course or action is irrational or incorrect, you might still follow the herd, believing they know something that you don’t.
It’s only natural that a majority get engulfed within the ‘group-think’, more now than ever because of the sheer amount of information that we consume via e-mail, social media and financial news providers. But it’s a trap! When markets are trending, yes, an established momentum of optimism occurs, probably but not always, resulting in outperformance of the index. But when markets come to a point of ‘exhaustion’, usually when few expect it to, then human instinct clicks in. Once benchmark indices trade lower, in any meaningful way, equities invariably follow lower too. During these declining phases, even though many equities may match the index in percentage terms, the fund manager that is herding is likely to get caught-up in executing at levels of stress when the equity is momentarily underperforming because everyone else is doing the same thing at the same time!
And there’s been plenty of those severe pullbacks in the stock markets over the last few years. Taking the S&P 500 index as a benchmark, there’s been three such sell-offs during the last 18 months alone – minus -9.8% per cent in September ’14, -12.4% per cent in July ’15 and more recently -14.4% per cent last November ’15. This excludes the larger decline of May ’11, -21.6% per cent and a few others in-between.
So how can we extricate ourselves from getting too caught up in herding?
One answer lies in the practice of de-herding – becoming more independent in thought and process. This doesn’t mean becoming a fixed ‘contrarian’, but at important inflexion points, yes, it becomes an essential quality to adopt. To do that, it is important to rely on some ‘anchors’ that will support us during stormy times. These anchors are certain laws that define financial markets that in turn, govern the price development of all indices and equities. These laws reverberate causing certain repetitions of market behaviour – this allows them to be monitored, tracked and even used to forecast future price development. These laws become very apparent through volatile times, like the period of the financial-crisis. The lows in March ’09 were predictable basis these laws. It takes time though, to build a ‘belief’ system in these anchors and everyone will be different in their assessment of such knowledge. But to those that can withdraw from the financial ‘noise’, great benefits await!
The anchors/laws are as follows:
- Market price activity alternates in periods of ‘action’ followed by ‘reaction’, ‘trend’ and ‘counter-trend’
- Historical price activity has a direct relevance/impact to its future development – know the past and the future becomes predictable
- Price activity forms recognisable ‘patterns’ that repeat over and over again
These patterns form in a specific sequence and are not random events
Varying patterns are limited to 13 basic formats that encompasses all market activity - These patterns form consistently and repetitively throughout many time-series – they can be observed spanning many decades or evolving within several minutes (fractal in nature) of price activity
- Pattern size/amplitude of price development is governed by its relative association within its peer/corresponding group – this means it is hierarchical in nature, forming larger/aggregate patterns with self-similar components and sub-components
- The size/amplitude of price activity/patterns can be measured using specific Fibonacci-Price-Ratio (FPR) measurements – these often produce accurate target levels calculated into the future
Most important of all, once an understanding of these laws/principles is obtained, it must be practiced – but only belief can instil its effectiveness. Fear must be overcome and that only visits us during times of extreme stress, when peer sentiment is wreaking havoc! But that is precisely the time to become the contrarian! A good example of this was when Warren Buffet began to buy equities, specifically, the banks near the lows of the financial-crisis in year-2009. Almost everyone else was selling. The outcome we know.
This was an extreme case of bearish sentiment of the time – if it could be reliably measured, it would probably read 80/100, a hundred being the worst case of pessimism or despondency on record (Great Depression, 1932?). There are different magnitudes of this condition too, and it’s opposite, optimism and euphoria. The sentiment measurement will be less in smaller percentage declines/advances. For example, what about the recent event in January/February ’16? Could the low traded in early/mid-February be predicted?
Could this have prevented underperformance of the underlying index? – Yes, Yes!
The global indices of the world markets are excellent proxies in tracking the overall trends of sector/derivative equites. Know how these perform, trend, and you have a pretty good idea if top-down, your equity is going to suddenly fall off a cliff, or be the defensive king!
Our methodology of using the anchors/laws is commonly known as the Elliott Wave Principle (EWP). It’s dynamic in nature and application – over the last 25 years, we’ve developed a proprietary way of measuring all the patterns identified by its discoverer, R.N. Elliott (1871-1948). This assists in the objective assessment of pattern identification. For example, using these laws, the underlying stock market sell-off in February ’16 was expected to finalise an important low – even though consensus at the time was very bearish with mainstream headlines/analysts calling for continued declines –
o January 29 – This reliable indicator says we’re in a bear market for stocks
o February 12 – JP Morgan Warns Upcoming Recession
o February 25 – Smart-beta guru is now warning of a crash
o February 29 – Investors pull more than $60bn from mutual funds
Contrastingly, major indices were forecast as forming an important low:
WaveTrack Report, February 5 – ‘Despite consensus pessimism throughout the stock market, especially since the banking sector is still working itself lower, there exists signs of an emerging recovery. Should shorter-term overhead resistance be overcome, it would signal a more sustained advance unfolding for the next several months with price targets to last year’s highs, and eventually beyond’. See fig’s #1 & #2 from that report:
S&P 500 – Daily – 5th February 2016
DJ Transportation Average – Daily – 5th February 2016
Start Index Tracking today! Get access to WaveTrack’s bi-weekly Elliott Wave Compass report featuring many short-term updates of various asset classes and three exclusive videos!
Successful trading with WaveTrack International
Subscribe to the EW-Compass here…
Dow Theory, Elliott Wave & the Golden Ratio Phi – What do they have in common?
by WaveTrack International| March 9, 2016 | No Comments

TradersWorld Issue #62 – Read WaveTrack’s latest article ‘Dow Theory, Elliott Wave & the Golden Ratio Phi’
The latest edition of the TradersWorld Magazine is hot of the press! The renown publication is again a gold mine of interesting articles, trends and trading ideas. Download your own free copy now. Click here!
On page 86 you find WaveTrack’s new article entitled ‘Dow Theory, Elliott Wave & the Golden Ratio Phi‘. It examines a lesser known aspect of Ralph Nelson Elliott’s study of Dow Theory and it principles and clearly outlines the essential tenets distilled in this process.
Dow’s Divergence Principle is explained in its historcial context as well as illustrated on the basis of the DJ Transportation Average chart. And finally, Peter Goodburn adds a new tenet to the process ‘Fibonacci-Price-Ratios’ as the perfect complement to examine patterns in a smaller time frame. Read the full article here: TradersWorld Issue #62
Interested in Elliott Wave? Get access to WaveTrack’s bi-weekly Elliott Wave Compass report featuring many short-term updates of various asset classes and three exclusive videos!
Read more about the latest Currencies (Forex) Video Update here!
Successful trading with WaveTrack International
Subscribe to the EW-Compass here…

Recent Posts
Recent Comments
Archives
- June 2026
- February 2026
- December 2025
- August 2025
- July 2025
- June 2025
- March 2025
- February 2025
- January 2025
- December 2024
- August 2024
- July 2024
- June 2024
- May 2024
- April 2024
- February 2024
- January 2024
- December 2023
- August 2023
- July 2023
- June 2023
- March 2023
- February 2023
- January 2023
- December 2022
- November 2022
- October 2022
- August 2022
- July 2022
- June 2022
- May 2022
- March 2022
- February 2022
- January 2022
- December 2021
- August 2021
- July 2021
- June 2021
- March 2021
- February 2021
- January 2021
- December 2020
- November 2020
- August 2020
- July 2020
- June 2020
- May 2020
- April 2020
- March 2020
- February 2020
- January 2020
- December 2019
- October 2019
- September 2019
- July 2019
- June 2019
- May 2019
- April 2019
- March 2019
- February 2019
- January 2019
- December 2018
- November 2018
- September 2018
- August 2018
- July 2018
- June 2018
- May 2018
- April 2018
- March 2018
- February 2018
- January 2018
- December 2017
- November 2017
- October 2017
- September 2017
- August 2017
- July 2017
- June 2017
- May 2017
- March 2017
- February 2017
- January 2017
- December 2016
- November 2016
- October 2016
- September 2016
- August 2016
- July 2016
- June 2016
- May 2016
- April 2016
- March 2016
- February 2016
- January 2016
- December 2015
- November 2015
- October 2015
- September 2015
- August 2015
- July 2015
- June 2015
- May 2015
- April 2015
- March 2015
- February 2015
- January 2015
- December 2014
- November 2014
- October 2014
- September 2014
- August 2014
- July 2014
- June 2014
- May 2014
- April 2014
- March 2014
- February 2014
- January 2014
- December 2013
- November 2013
- October 2013
- September 2013
- August 2013
- July 2013
- June 2013
- May 2013
- April 2013
- March 2013
- February 2013
- January 2013
- December 2012
- November 2012
- October 2012
- September 2012
- August 2012
Categories
- ADXY Index
- Agnico Eagle Mines
- AI Artificial Intelligence
- Alcoa
- Amazon
- AngloGold Ashanti
- Antofagasta
- APPL
- Apple
- ASX 200
- AUD vs USD
- AUDNZD
- AUDUSD
- Australia ASX 200
- Baltic Dry Index
- Banking
- Base Metals
- Biotechnology
- Bitcoin
- Bovespa
- Broadcom
- Catalexit
- central banks
- Christmas
- Commodities
- Commodities Video Outlook 2020
- Conference
- Copper
- Coronavirus Sell-Off
- CRB
- Crude oil
- crude oil price chart
- CryptoCurrency
- Currencies
- Currencies + Interest Rates Video Outlook
- Cycles
- Dax 30
- deutsche bank
- Dewey Cycle
- DJ Transportation Average
- DJ Utilities
- Dow Jones 30
- Dow Theory
- ECB
- economy
- Elliott Wave
- Elliott Wave Charts
- Elliott Wave Patterns
- Elliott Wave Principle
- Emerging Markets
- Ending-Diagonal Elliott Wave Pattern
- Equity
- EUR vs CHF
- EUR/USD
- Euro / US$
- Eurostoxx 50
- EuroStoxx50
- EuroStoxxBanks
- EURUSD
- Expanding Flat Pattern
- FAAMG
- FANG+
- fib-price-ratio
- Fibonacci Trading
- Fibonacci-Price-Ratio
- Financial Forecasting
- Fixed Income
- forex
- Freeport McMoran
- FTSE 100
- Fund Management
- FX
- FXStreet
- GBP/AUD
- GBP/USD
- GDX
- GDXJ
- Germany 10 year Euro Bund future
- Gilead Sciences
- Glencore
- Global Economy
- Gold
- Gold Mining
- Golden Ratio
- goldman sachs
- Google Inc.
- Google/Alphabeth
- Greek debt crisis
- Hang Seng
- Harbinger
- Hungarian Forint
- IBEX 35 Index Spain
- Independent Research
- India-CNX Nifty 50
- Interest Rates
- Interview
- IRP Independent Research
- kbw bank index
- Lonmin
- MAG-7
- McDonald's
- MID-YEAR VIDEO UPDATE!
- Mifid II
- Mines
- Mining
- MSCI China
- MSCI Emerging Markets
- Nasdaq 100
- Nasdaq Biotechnology Index
- Nasdaq Composite
- Nasdaq100
- Netflix
- Newmont Mining
- Nikkei 225
- NVIDIA
- NYSE Composite Index
- Palladium
- Platinum
- Precious Metals
- Ralph Nelson Elliott
- Reversal-Signature
- Russell 2000
- Russia RTS
- S&P 500
- Sector
- Secular-Bull
- Sentiment Survey
- Shanghai Composite Index
- Silver
- Slanting Flat Elliott Wave Pattern
- SP100
- SP400 Mid-Cap
- SP500
- SPX 500
- STLG/AUD
- Stlg/US$
- STLG/USD
- STLG/YEN
- STLG/ZAR
- Stock Index
- Stock Index Tracking
- Stock Index Video
- Stock Indices
- Stock Indices Video Outlook 2023
- Stock Indices Video Outlook 2025
- Sugar
- Summary
- Tesla
- Tesla Inc
- Toyota
- Track Record
- trading
- Trusts
- Tutorial
- Uncategorized
- UniCredit
- US
- US Dollar Index (DXY) (USDX)
- US$ Index
- US-Dollar Index
- US10yrYields
- USD
- USD/ARS
- USD/CNY
- USD/IDR
- USD/INR
- USD/MXN
- USD/SGD
- USD/THB
- USD/YEN
- USD/ZAR
- Vale
- Value Line Index
- video
- VIDEO OUTLOOK 2018
- VIDEO OUTLOOK 2020
- VIX
- W.D. Gann
- WaveTrack International
- XAU Gold/Silver Index
- Xetra Dax
- XOP
- Yields
- Zig Zag
- Zinc
- ‘INFLATION-POP’
- ‘SHOCK-POP-DROP’