Presidential Election – TRUMP Win! – Elliott Wave
by WaveTrack International| November 9, 2016 | No Comments
S&P500 – 240 mins vs. S&P 500 E-Mini
WRONG ELECTION CALL – CORRECT MARKET FORECAST
S&P 500
Donald Trump has just passed through the electoral finishing line ahead of Hilary Clinton to become President elect. That was a surprise outcome given the proximity and location of various stock indices – but the real irony is the fact that the market’s reaction is behaving perfectly in-line with the Elliott Wave forecasts!
The August decline was labelled as a developing zig zag pattern with downside targets towards 2067.25+/- basis the cash index. The cash index is currently closed having ended last night (Tuesday) at 2139.53. But the futures contract has reacted down to 2028.50 on news that Trump was first to reach 270 electoral votes but in so doing, has ended the zig zag at this lower level, derived not by extending wave (a) of the zig zag by a fib. 61.8% ratio but by a fib. 100% ratio.
The markets have reacted higher since to 2095.00.
What does this tell us about the future direction of the S&P? Firstly, it affirms the assumption that the August decline is a counter-trend within the larger/aggregate uptrend – so that refutes the doom & gloom-ers that cite a secular-bear decline about to begin. Secondly, the counter-trend reaction that has already begun following the trade to 2028.50 is likely to last another few trading days, perhaps ending sometime early next week. This will enable indices like the Biotechnology (NBI) index to complete its own counter-trend upside rally (see Tuesday’s blog).
On another level, a Trump victory seems not to have changed the larger/aggregate picture as described in recent months. The short-term rallies may extend into next week but then fade as the larger, more bearish patterns are still indicating a double-digit percentage decline lies ahead.
This inevitably means adopting the more bearish ‘alternate count’ #2 scenario for the S&P where today’s zig zag completion to 2028.50 is simply the first zig zag in an ongoing double formation. A secondary zig zag decline would eventually pull the index lower over the next few months towards 1934.00+/-. This would align with the double-digit percentage declines we expect from other major indices, notably the Eurostoxx 50 and the Nikkei 225.
More on this subject in tonight’s Market Report
Presidential Election – Clinton Win! – Elliott Wave
by WaveTrack International| November 8, 2016 | No Comments
Presidential Election – Clinton Win! – Elliott Wave
Biotechnology Index (NBI)
As the U.S. electorate goes to the polls, it still seems that the battle between Trump & Clinton is a close-run race for the White House. Latest opinion-polls places Trump on 43.6% of the vote, Clinton slightly ahead at 46.8% per cent, 9.6% per cent abstaining. But can the Elliott Wave Principle offer some insights ahead of the result?
In last Friday’s report, we had identified a counter-trend rally for most of the major global stock markets about to begin – that was confirmed Monday morning when the FBI announced Clinton’s reprieve. But now that prices have rallied higher, is this just a counter-trend rally and the prelude to a major sell-off ahead of a Trump win? The latest update of the short-term wave development of the Biotechnology index (NBI) says no.
Biotechnology Index – 30 mins.
During the last month, the Biotechnology index (NBI) has underperformed the market significantly, declining from its late-September high by -18% per cent. But its five wave pattern has been confirmed as ending just a few days ago at 2582.20. A counter-trend upswing has only just begun. R.N. Elliott’s guideline is that a corrective [rally] will return prices to ‘fourth wave preceding degree’, towards 2827.09, in which case, this has more upside potential.
The markets binary-think assessment of the election outcome is that a Trump win would send the major market indices down by between 5-10% per cent. Basis this Elliott Wave count, that outcome can be eliminated. It would indicate a Clinton victory.
Looking ahead, the upswing is so far, attempting to unfold into a five wave impulse pattern – a fib. 38.2% correction would take the index to an interim target at 2787.00+/-. Extending this by a fib. 61.8% ratio would eventually take the index above resistance at ‘fourth wave preceding degree’, towards the fib. 61.8% retracement area at 2923.00+/-.
Get access to WaveTrack’s bi-weekly Elliott Wave Compass reportfeaturing many short-term updates of all 4 asset classes!
Successful trading with WaveTrack International
Subscribe to the EW-Compass here…
SP500 Cycle – PLUS Elliott Wave ‘Buy Signal’
by WaveTrack International| October 17, 2016 | No Comments
Ensure you Subscribe to WaveTrack’s Video Series
SP500 Cycle – PLUS Elliott Wave ‘Buy Signal’
This is just one of WaveTrack International’s proprietary devised composite cycles for the S&P 500. It highlighted this year’s major low last January/February as the index traded to an extremity of 1810.10. It also combined with Elliott Wave analysis that pinpointed the low as ending a multi-month double zig zag pattern that began from the May ’15 high. When these two deterministic disciplines come together, a high-probability event is triggered.
S&P 500 Cycle – Combined with Elliott Wave ‘Buy Signal’
The rest is history – the S&P has since traded to new record highs, to 2193.81 into a mid-August high. The composite cycle also forewarned that the next important cycle-peak would come in late-July.
If you’d like to examine these cycles for yourself, send us a message requesting our latest video series updates of the medium/long-term forecasts for STOCK INDICES. Use the Help-desk located at wavetrack.com or send us an e-mail request (address in same location). June publication – US$48.00.
For Institutional buy-side organisations, please contact us for subscriptions to the monthly Elliott Wave Forecast/Navigator reports here or read more about our services here.
HOW CAN YOU RECEIVE THE VIDEO FORECAST?
To receive your VIDEO UPDATE please click here to contact us.
– Please state if you wish to purchase the SINGLE VIDEO for STOCK INDICES for USD 48.00? Read the full Table of Content of this amazing video here!
– Or opt for the TRIPLE PACKAGE for USD 96.00 in total?
– Next we will send you a PayPal payment request and provide you with the video link & PDF report once confirmed.
We’re sure you’ll reap the benefits – don’t forget to contact us with any Elliott Wave questions – Peter is always keen to hear you views, queries and comments.
Most sincerely,
WaveTrack’s Elliott Wave Team
Visit us @ www.wavetrack.com
Tags: Composite Cycle
Eurostoxx 50 – Elliott Wave Running Flat
by WaveTrack International| October 12, 2016 | No Comments
EuroStoxx 50 – 60 mins. Elliott Wave Forecast
Elliott Wave Running Flat – Eurostoxx 50
READY – STEADY – GO (ING DOWN)!
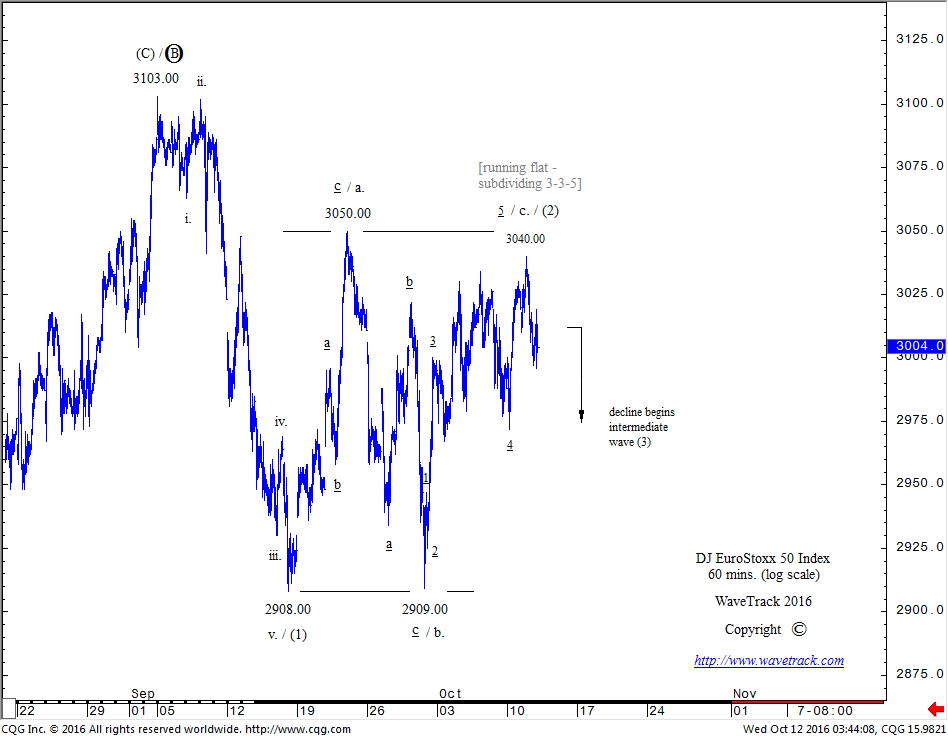
Our recent short-term post of the Eurostoxx 50 described how a horizontal flat corrective patterns turns into a running flat. Actually, the only real difference is in the way its third sequence, labelled wave c. (minor degree) falls short of ‘idealised’ horizontal/parallel targets which effectively means it ‘truncates’, due to a build-up of selling pressure, as in the case of this example – see fig #1.
This is not just educational because it also offers a glimpse into how this index is changing direction and now heading lower. The horizontal/running flat pattern has finalised this balancing/corrective sequence in response to the earlier five wave expanding-impulse decline that unfolded between 3103.00-2908.00 as intermediate wave (1). This establishes a downtrend. So now, with the horizontal/running flat pattern ending wave (2), there is a heightened probability that the downtrend will now resume, as wave (3) with some impressive declines ahead.
Get access to WaveTrack’s bi-weekly Elliott Wave Compass report featuring many short-term updates of all 4 asset classes!
Successful trading with WaveTrack International
Subscribe to the EW-Compass here…
GOLD – Elliott Wave Compass Track Record and Forecast!
by WaveTrack International| October 6, 2016 | No Comments
GOLD – 420 mins. Forecast dated 8th July 2016
Elliott Wave Compass Track Record – SELL SIGNAL GOLD – July 8th 2016 – Gold Declines Ahead!
How did you do? Accountability: this is one of WaveTrack’s amazing forecasts published in the renown Elliott Wave insider publication called Elliott Wave Compass.
Get access to WaveTrack’s bi-weekly Elliott Wave Compass report featuring many short-term updates of all 4 asset classes!
Successful trading with WaveTrack International
Subscribe to the EW-Compass here…
Eurostoxx 50 – Elliott Wave Running Flat
by WaveTrack International| October 4, 2016 | No Comments
When a Horizontal Flat turns into a Running Flat
Recent updates in our bi-weekly reports have intoned a very bearish outlook for global stock markets for the next several months. This is mainly because of multi-month running flat patterns unfolding in indices like the Eurostoxx 50 and Nikkei 225, ending early-September.
EuroStoxx 40 – 60 mins.
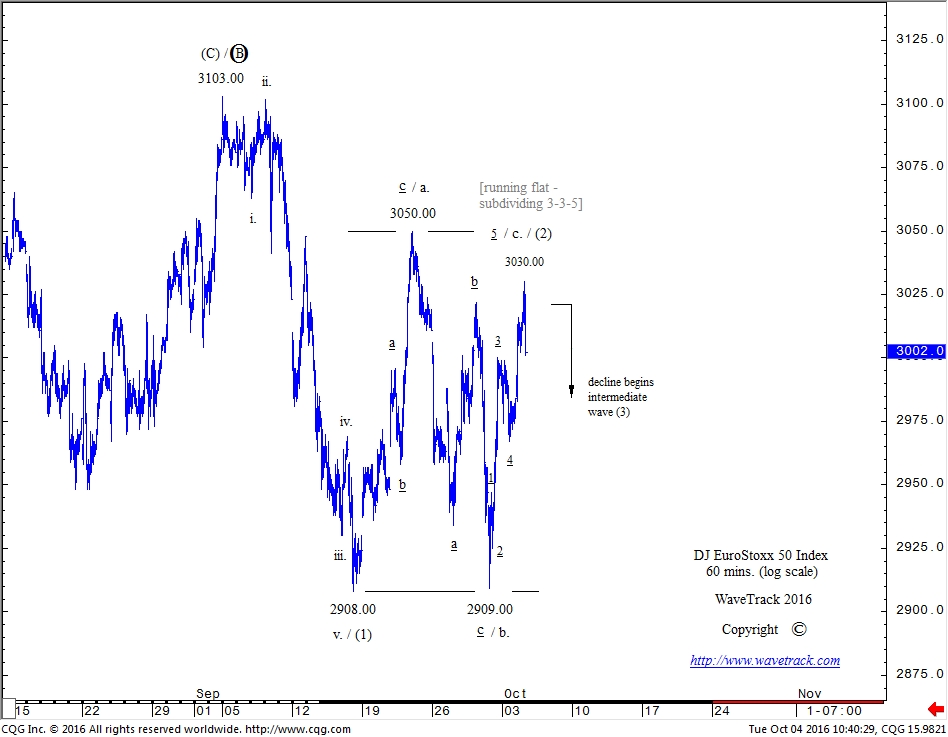
For the Eurostoxx 50, this running flat pattern ended at 3103.00 (futures). The subsequent decline affirms the bearish outlook for the next several months because it unfolded into a clearly visible Elliott Wave impulse pattern, specifically, a five wave expanding-impulse ending at 2908.00 – see chart, fig #1.
This has subsequently been balanced by a counter-trend upswing which is just completing, now, at 3030.00. The correction has unfolded into a horizontal flat and labelled in minor degree, a-b-c, subdividing 3-3-5. The horizontal flat is identified because its second sequence, minor wave b. unfolded into a three wave zig zag, but completed at the horizontal low of the origin of minor wave a., at 2908.00.
Ordinarily, the third sequence as minor wave c. would be expected to now unfold higher whilst unfolding into a five wave pattern, but ending at the horizontal high that ended minor wave a. / began minor wave b. at 3050.00. But in this case, it has run short, ending the five wave pattern at 3030.00. This means the horizontal flat changes into a running flat because wave c. is ‘truncated’.
Some Elliott Wave practitioners eliminate the possibility that a horizontal flat, where waves a. and b. remain horizontal can allow wave c. to run short to mutate into a running flat. The argument is that wave b. ordinarily would break below the extremity of wave a. to validate this. For the record, this is not necessary, as this chart proves.
Get access to WaveTrack’s bi-weekly Elliott Wave Compass report featuring many short-term updates of all 4 asset classes!
Successful trading with WaveTrack International
Subscribe to the EW-Compass here…
The Silver Wheaton Difference!
by WaveTrack International| September 22, 2016 | 1 Comment

Silver Wheaton – Metals & Mining Update
[THE FOLLOWING IS AN EXTRACT FROM WAVETRACK’S INSTITUTIONAL EQUITY SERVICES]
Many of the silver miners formed simultaneous lows last January (2016) which have since triggered new intermediate & medium-term uptrends. For some, the January lows ended counter-trend zig zag/double zig zag patterns dating back to pre-financial-crisis highs of Nov.’07/April 2008 i.e. Silver Standard Resources, Pan-American Silver Corp. whilst Silver Wheaton Corp. simply ended a smaller counter-trend phase of declines that began from the April ’11 highs. The big difference was that Silver Wheaton Corp. did not break below its financial-crisis low of 2.51 whilst the others did in order to complete their own corrective patterns. This means that Silver Wheaton Corp. is outperforming relative to its 2011 high.
There is scant historical data for these equities which makes intermediate/medium-term forecasting difficult, in terms of precise wave counting but especially true for amplitude measurements. All we do know is that if medium-term Fibonacci-Price-ratios are used for Silver Standard Resources & Pan-American Silver Corp., measuring their initial advances from major lows of August ’98 and April ’01 respectively into those pre-financial-crisis highs, adding these fib. 100% ratios for an equality measurement from the Jan.’16 lows, then upside targets are towards 279.00+/- and 98.50+/-. That’s gains of 7,543% and 1,730%. For Silver Wheaton Corp. a similar fib. 100% equality ratio is used measuring the post-financial-crisis upswing then adding this to the Jan.’16 low of 10.04 to yield targets towards 190.40+/- reflecting potential gains of 1,800% per cent. As historical data is even shorter for Silver Wheaton Corp., such targets could be erroneous. For the time being, we rely on the internal structure of January’s developing five wave impulse advance to determine that a minimum upside target towards 71.00+/- is viable during the next couple of years.
Elliott Wave Case Study
There is still doubt in many quarters of the commodity markets that industrial metals, like silver have begun new uptrends. It was earlier this year when commodity prices extended lower in January/February that mainstream analysts were marking prices heavily down alongside forecasts of incremental U.S. interest rate rises. Neither were realised. Even though some impressive gains have since taken place, sceptics continue to argue the bearish case that rallies are simply counter-trend – that major secular-bear downtrends are in progress. The purpose of examining price declines of Silver Wheaton Corp. during the year-2011/2016 period is an attempt to ‘proof’ this was just a counter-trend sequence within a prevailing uptrend.
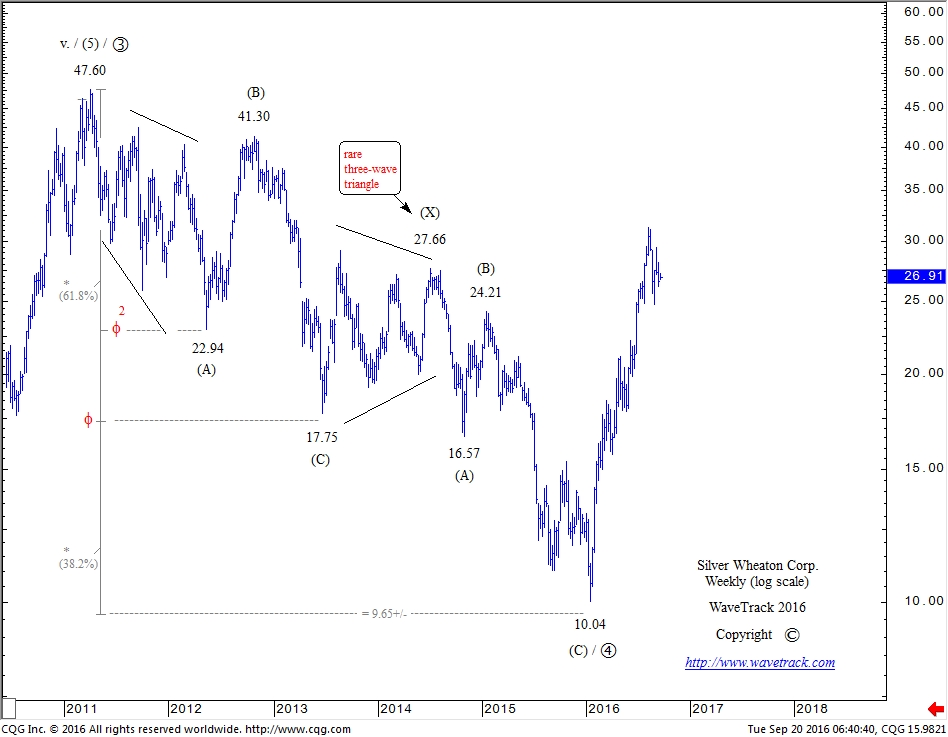
Silver Wheaton Corp. – Weekly – Forecast
An important high formed in April ’11 at 47.60 – see fig #1. As historical data is limited (begins July ’05), this high represented a new record high which for the purposes of examination, ended primary wave 3 although we can’t be certain. But what is very tangible is the way the subsequent declines have unfolded as primary wave 4 – into a precise Elliott Wave corrective pattern, a seven price-swing double zig zag labelled in intermediate degree, (A)-(B)-(C)-(X)-(A)-(B)-(C).
There are some interesting aspects of this pattern. For example, it began with a leading-expanding-diagonal as wave (A), completing into the May ’12 low at 22.94. This is quite an unusual start for a multi-year decline, but perfectly acceptable. Wave (B) rallies followed, complying with one of R.N. Elliott’s guidelines where retracements head back towards ‘fourth wave preceding degree’, as it did ending at 41.30. Wave (C) declines then got underway, unfolding into a more common five wave ‘expanding-impulse’ pattern defined where its 3rd wave undergoes ‘price-expansion’, eventually ending at 17.75. This is an extension to ‘alternation’ as we know it – so this guideline adopts the concept that if wave (A) unfolds into a ‘diagonal-impulse’ then wave (C) has a tendency to unfold into a more simplistic ‘expanding-impulse’ (and vice-versa).
Now it’s worth noting Fibonacci-Price-Ratio analysis because extending wave (A) by a fib. 38.2% ratio projects the terminal low for wave (C) towards 17.36+/-. The actual low ended just a fraction higher at 17.75 – good enough to verify!
TIP: Why use a fib. 38.2% ratio and not 61.8%? One of the fib-price-ratio guidelines that we’ve documented is this – when wave (B) retraces wave (A) by a fib. 50% ratio or more, then extend wave (A) by a fib. 38.2% ratio to determine the terminal completion of wave (C). If on the other hand, wave (B) ends shorter than a fib. 50%, use 61.8%.
The next observation was something unusual. Intermediate wave (X) unfolded into a three wave triangle, not a conventional five wave sequence. Each of these three price-swings subdivide into 3’s three’s, but the completion at 27.66 leaves behind only a three wave triangle. We’ve documented these in the past and have archived them for reference, but the fact that they can occur is enough to validate one trading guideline that we use daily – never await the completion of a five price-swing triangle to take a trade – always attempt to initiate the trade at the end of the third sequence. Unless this is an expanding triangle, trading wave ‘c’s completion won’t stop you out as wave ‘e’ will normally complete within wave ‘c’s range.
The secondary zig zag pattern began from 27.66 with wave (A) ending at 16.57 – nothing unusual about this except that it ended up being quite a bit shorter than wave (C). Now, to determine a terminal low for the secondary zig zag, the first between 47.60-17.75 must be extended by two ratios – fib. 38.2% and 61.8% projecting downside targets to either 12.18+/- or 9.65+/-. Then, cutting the secondary zig zag from 27.66 by a fib. 61.8% ratio to both downside levels, an interim target for the secondary (A) wave is derived, to either 16.70+/- or 14.40+/-. When wave (A) ended at 16.57, close to the 16.70+/- level it originally heightened the probability of wave (C) eventually ending at 12.18+/-.
When wave (C) did get underway, the internal structure of the pattern did not compete a five wave subdivision into the 12.18+/- level, so this was the first indication that it would eventually extend to the next ‘golden-section’ 0.618 number towards 9.65+/-. The actual low formed at 10.04 but justifying that golden-section ratio with a reversal-signature afterwards. It’s also a good idea to compare Silver Wheaton Corps. pattern with its peers – this often assists in determining a more exact, terminal low.
The rest is history – a new multi-year uptrend has since begun.
For information on WaveTrack’s INSTITUTIONAL EQUITY SERVICES, please contact the HELP-DESK located at the top of our home page www.wavetrack.com or visit WaveTrack’s On-Deman Services page.
Nikkei-Biotech
by WaveTrack International| August 5, 2016 | 4 Comments
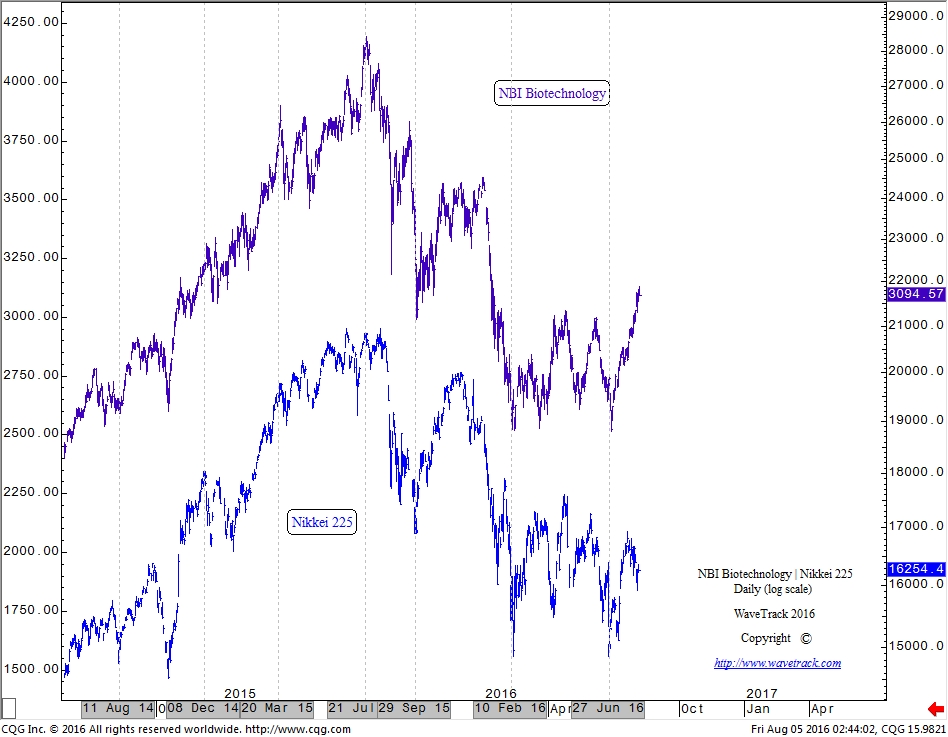
NBI Biotechnology | Nikkei 225 – Daily
Unlikely Partners – late-June lows trade just a few pips below February low – major Elliott Wave significance.
This positive-correlation chart ties together the most unlikely partners. What connection is there between the NBI Biotechnology index and the Nikkei 225 index? Probably little, but the correlation is very distinct.
What is most impressive is the way that each index declined just a few points below the Feb.’16 lows during the late-June, post-Brexit sell-off. When this occurred for the Nikkei, it effectively negated the concept of ending primary wave 4’s counter-trend decline from last years’ high earlier, into the Feb.’16 low. It means that a zig zag into the Feb.’16 low is currently being balanced by a corrective pattern prior to beginning another, secondary zig zag to even lower levels.
The NBI index has outperformed relative to its April high, but as it also declined marginally lower last June, this is simply an expanding flat correction prior to the commencement of another, severe decline to lower lows.
Get access to WaveTrack’s bi-weekly Elliott Wave Compass report featuring many short-term updates of all 4 asset classes!
Successful trading with WaveTrack International
Subscribe to the EW-Compass here…
Tags: Biotech
TRADERS WORLD MAGAZINE – Elliott Wave
by WaveTrack International| July 14, 2016 | No Comments
Read WaveTrack’s latest Case Study on Fibonacci and United Technology on page 81
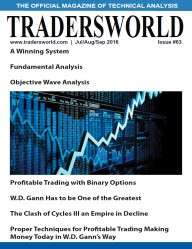
WaveTrack’s head analyst Peter Goodburn published his latest indepth Elliott Wave article in this edition on page 81 ‘Elliott Wave Analysis Case Study + Fibonacci of United Technologies’. Check it out! Traders World #63
Larry Jacobs the Editor in Chief of the Traders Word Magazine created this specific edition to address common trading mistakes, e.g. have you ever watched a stock go down and down until it loses most of its value? Or have you gotten out way too soon and sold a stock that went up and up and left big profits on the table? If you have experiences this then this new Traders World edition has insightful articles and investing strategies that can save you from catastrophic hits to your account in even the most turbulent market conditions.
Larry Jacobs knows that even the most seasoned money managers have problems when it comes to the impact of outside events on their stocks. He believes that the development of risk management strategies are essential for sustained success. There are a variety of techniques that you can use by reading Traders World magazine. Download the latest edition here: Traders World #63
Get access to WaveTrack’s bi-weekly Elliott Wave Compass report featuring many short-term updates of all 4 asset classes!
Successful trading with WaveTrack International
Subscribe to the EW-Compass here…
Tags: United Technology
FOREX and INTEREST RATES – Post-Brexit Video Update!
by WaveTrack International| June 27, 2016 | No Comments
Forex and Interest Rates Video Update! Post-Brexit – Order resides in Chao
POST-BREXIT – Order resides in Chaos!
This mid-year video update is the third and final installment in the three-part series of Elliott Wave Forecasts. Part III takes a look at the developing trends of CURRENCIES & INTEREST RATES and comes just a couple of days following the U.K.’s referendum ‘Brexit’ vote.
We take a look at the aftermath of the Brexit and attempt to answer whether there’s been any material change in the larger trends of global currency pairs and crosses that were already in motion beforehand. We’ll be covering over 48 charts and examining the Elliott Wave pattern development of the following:
• US$ index
• Euro/US$
• Stlg/US$
• US$/Yen
• US$/CHF
• AUD/US$
• US$/CAD
• Euro/Stlg
• Euro/Yen
• Asian ADXY
• US$/ZAR
• US$/BRL
• US$/CNY
Major cycles are also updated along with a cursory look at the US$ dollar versus the Korean Won, Singapore Dollar, Indian Rupee, Taiwan Dollar, Thai Baht, Malaysian Ringgit, Indonesia Rupiah and the Philippine Peso.
Sterling/British Pound has obviously seen the largest movements following the Brexit announcement, but you might be surprised to see how it looks within the long-term trend against the US$ dollar. We also find some confirmatory pattern development for Sterling/British Pound against the Euro.
In terms of interest rate analysis, we add the U.K.’s UK10yr yield analysis for the first time into the video series. We take a look at its long-term yield decline from the inflationary heights of the early 1980’s and what impact last week’s decline had when it traded down to new 35-year lows. We also clarify the ongoing trends for the US10yr treasury yield with updated target levels for year-end – plus the very latest effects of the ECB’s recent attempts to stem deflation in the Eurozone and the Bund Yield’s safe-haven effects following Brexit.
• US 30yr Yields
• US 10yr Yields
• US 10yr Yields Cycle
• Germany 10yr Yields
• UK 10yr Yields
HOW CAN YOU RECEIVE THE VIDEO FORECAST?
To receive your VIDEO UPDATE please click here to contact us.
– Please state if you wish to purchase the SINGLE VIDEO for either STOCK INDICES or COMMODITIES or CURRENCIES/INTEREST RATS for USD 48.00 (plus VAT)?
– Or opt for the TRIPLE PACKAGE for USD 96.00 in total?
– Next we will send you a PayPal payment request and provide you with the video link & PDF report once confirmed.
This is the most insightful and precise Elliott Wave financial forecast available.
Most sincerely,
WaveTrack’s Elliott Wave Team
Visit us @ www.wavetrack.com or read more about our STOCK INDICIES VIDEO UPDATE here
Visit us @ www.wavetrack.com or read more about our COMMODITIES VIDEO UPDATE here

Recent Posts
Recent Comments
Archives
- February 2026
- December 2025
- August 2025
- July 2025
- June 2025
- March 2025
- February 2025
- January 2025
- December 2024
- August 2024
- July 2024
- June 2024
- May 2024
- April 2024
- February 2024
- January 2024
- December 2023
- August 2023
- July 2023
- June 2023
- March 2023
- February 2023
- January 2023
- December 2022
- November 2022
- October 2022
- August 2022
- July 2022
- June 2022
- May 2022
- March 2022
- February 2022
- January 2022
- December 2021
- August 2021
- July 2021
- June 2021
- March 2021
- February 2021
- January 2021
- December 2020
- November 2020
- August 2020
- July 2020
- June 2020
- May 2020
- April 2020
- March 2020
- February 2020
- January 2020
- December 2019
- October 2019
- September 2019
- July 2019
- June 2019
- May 2019
- April 2019
- March 2019
- February 2019
- January 2019
- December 2018
- November 2018
- September 2018
- August 2018
- July 2018
- June 2018
- May 2018
- April 2018
- March 2018
- February 2018
- January 2018
- December 2017
- November 2017
- October 2017
- September 2017
- August 2017
- July 2017
- June 2017
- May 2017
- March 2017
- February 2017
- January 2017
- December 2016
- November 2016
- October 2016
- September 2016
- August 2016
- July 2016
- June 2016
- May 2016
- April 2016
- March 2016
- February 2016
- January 2016
- December 2015
- November 2015
- October 2015
- September 2015
- August 2015
- July 2015
- June 2015
- May 2015
- April 2015
- March 2015
- February 2015
- January 2015
- December 2014
- November 2014
- October 2014
- September 2014
- August 2014
- July 2014
- June 2014
- May 2014
- April 2014
- March 2014
- February 2014
- January 2014
- December 2013
- November 2013
- October 2013
- September 2013
- August 2013
- July 2013
- June 2013
- May 2013
- April 2013
- March 2013
- February 2013
- January 2013
- December 2012
- November 2012
- October 2012
- September 2012
- August 2012
Categories
- ADXY Index
- Agnico Eagle Mines
- AI Artificial Intelligence
- Alcoa
- Amazon
- AngloGold Ashanti
- Antofagasta
- APPL
- Apple
- ASX 200
- AUD vs USD
- AUDNZD
- AUDUSD
- Australia ASX 200
- Baltic Dry Index
- Banking
- Base Metals
- Biotechnology
- Bitcoin
- Bovespa
- Broadcom
- Catalexit
- central banks
- Christmas
- Commodities
- Commodities Video Outlook 2020
- Conference
- Copper
- Coronavirus Sell-Off
- CRB
- Crude oil
- crude oil price chart
- CryptoCurrency
- Currencies
- Currencies + Interest Rates Video Outlook
- Cycles
- Dax 30
- deutsche bank
- Dewey Cycle
- DJ Transportation Average
- DJ Utilities
- Dow Jones 30
- Dow Theory
- ECB
- economy
- Elliott Wave
- Elliott Wave Charts
- Elliott Wave Patterns
- Elliott Wave Principle
- Emerging Markets
- Ending-Diagonal Elliott Wave Pattern
- Equity
- EUR vs CHF
- EUR/USD
- Euro / US$
- Eurostoxx 50
- EuroStoxx50
- EuroStoxxBanks
- EURUSD
- Expanding Flat Pattern
- FAAMG
- FANG+
- fib-price-ratio
- Fibonacci Trading
- Fibonacci-Price-Ratio
- Financial Forecasting
- Fixed Income
- forex
- Freeport McMoran
- FTSE 100
- Fund Management
- FX
- FXStreet
- GBP/AUD
- GBP/USD
- GDX
- GDXJ
- Germany 10 year Euro Bund future
- Gilead Sciences
- Glencore
- Global Economy
- Gold
- Gold Mining
- Golden Ratio
- goldman sachs
- Google Inc.
- Google/Alphabeth
- Greek debt crisis
- Hang Seng
- Harbinger
- Hungarian Forint
- IBEX 35 Index Spain
- Independent Research
- India-CNX Nifty 50
- Interest Rates
- Interview
- IRP Independent Research
- kbw bank index
- Lonmin
- MAG-7
- McDonald's
- MID-YEAR VIDEO UPDATE!
- Mifid II
- Mines
- Mining
- MSCI China
- MSCI Emerging Markets
- Nasdaq 100
- Nasdaq Biotechnology Index
- Nasdaq Composite
- Nasdaq100
- Netflix
- Newmont Mining
- Nikkei 225
- NVIDIA
- NYSE Composite Index
- Palladium
- Platinum
- Precious Metals
- Ralph Nelson Elliott
- Reversal-Signature
- Russell 2000
- Russia RTS
- S&P 500
- Sector
- Secular-Bull
- Sentiment Survey
- Shanghai Composite Index
- Silver
- Slanting Flat Elliott Wave Pattern
- SP100
- SP400 Mid-Cap
- SP500
- SPX 500
- STLG/AUD
- Stlg/US$
- STLG/USD
- STLG/YEN
- STLG/ZAR
- Stock Index
- Stock Index Tracking
- Stock Index Video
- Stock Indices
- Stock Indices Video Outlook 2023
- Stock Indices Video Outlook 2025
- Sugar
- Summary
- Tesla
- Tesla Inc
- Toyota
- Track Record
- trading
- Trusts
- Tutorial
- Uncategorized
- UniCredit
- US
- US Dollar Index (DXY) (USDX)
- US$ Index
- US-Dollar Index
- US10yrYields
- USD
- USD/ARS
- USD/CNY
- USD/IDR
- USD/INR
- USD/MXN
- USD/SGD
- USD/THB
- USD/YEN
- USD/ZAR
- Vale
- Value Line Index
- video
- VIDEO OUTLOOK 2018
- VIDEO OUTLOOK 2020
- VIX
- W.D. Gann
- WaveTrack International
- XAU Gold/Silver Index
- Xetra Dax
- XOP
- Yields
- Zig Zag
- Zinc
- ‘INFLATION-POP’
- ‘SHOCK-POP-DROP’